Introduction to
R & RStudio
Dr. Ajay Kumar Koli, PhD
- Founder & Director of SARA
- JNU, Pondicherry Central University, University of Hyderabad, University of Würzbürg
- Pursuing MSc Data Science from IGNOU

Slides prepared with 💙 & Quarto
Data Science Project
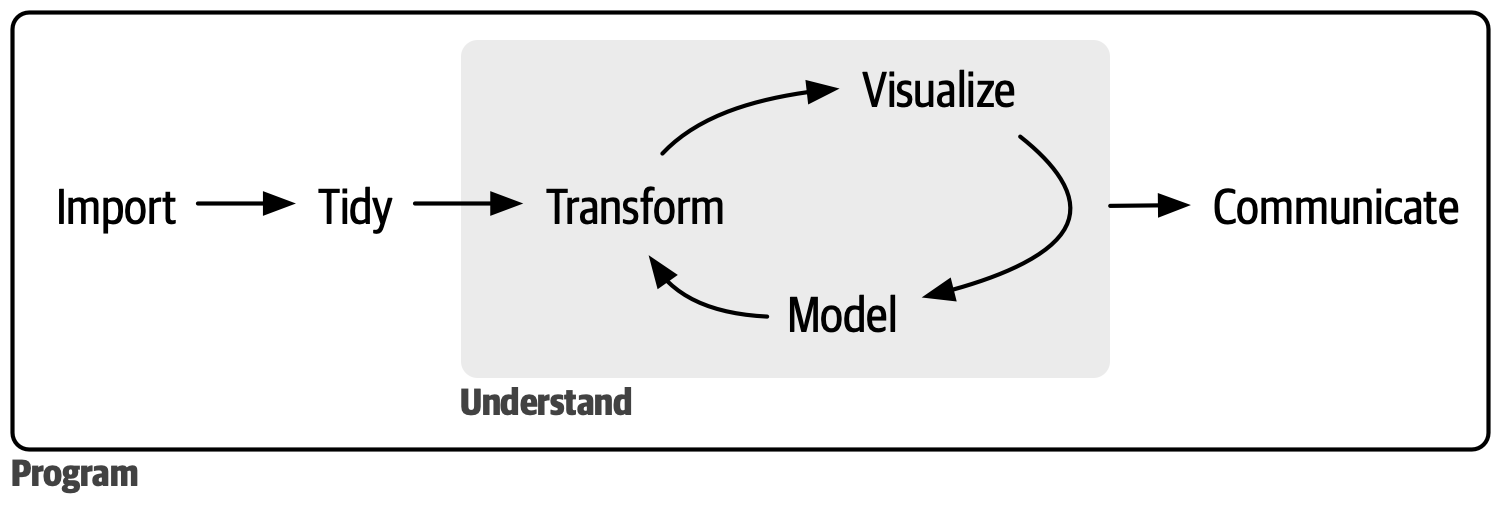
Image source: https://r4ds.hadley.nz/
The R Programming Language

“R is a free software environment for statistical computing and graphics.”
R website link: https://www.r-project.org/
🥳 Latest Ranking of R
Rank #8 in May 2026: Highest Position (since 2007)
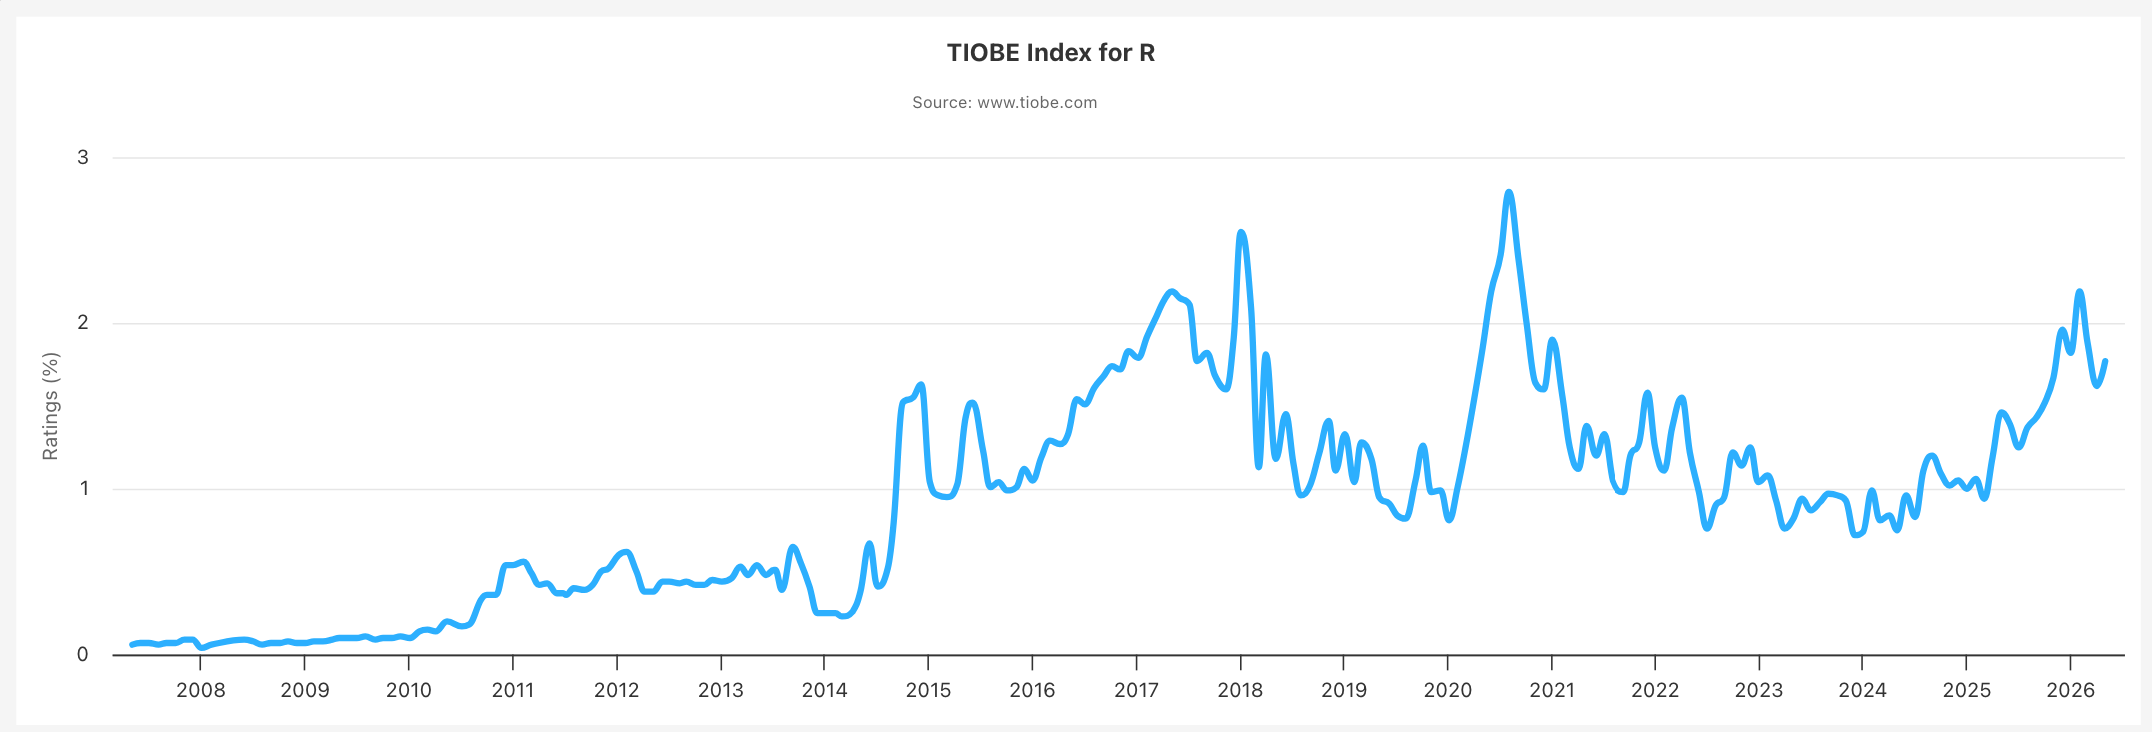
History of R
Intially as S language by Bell Labs.
First appeared in August 1993 as R language by:


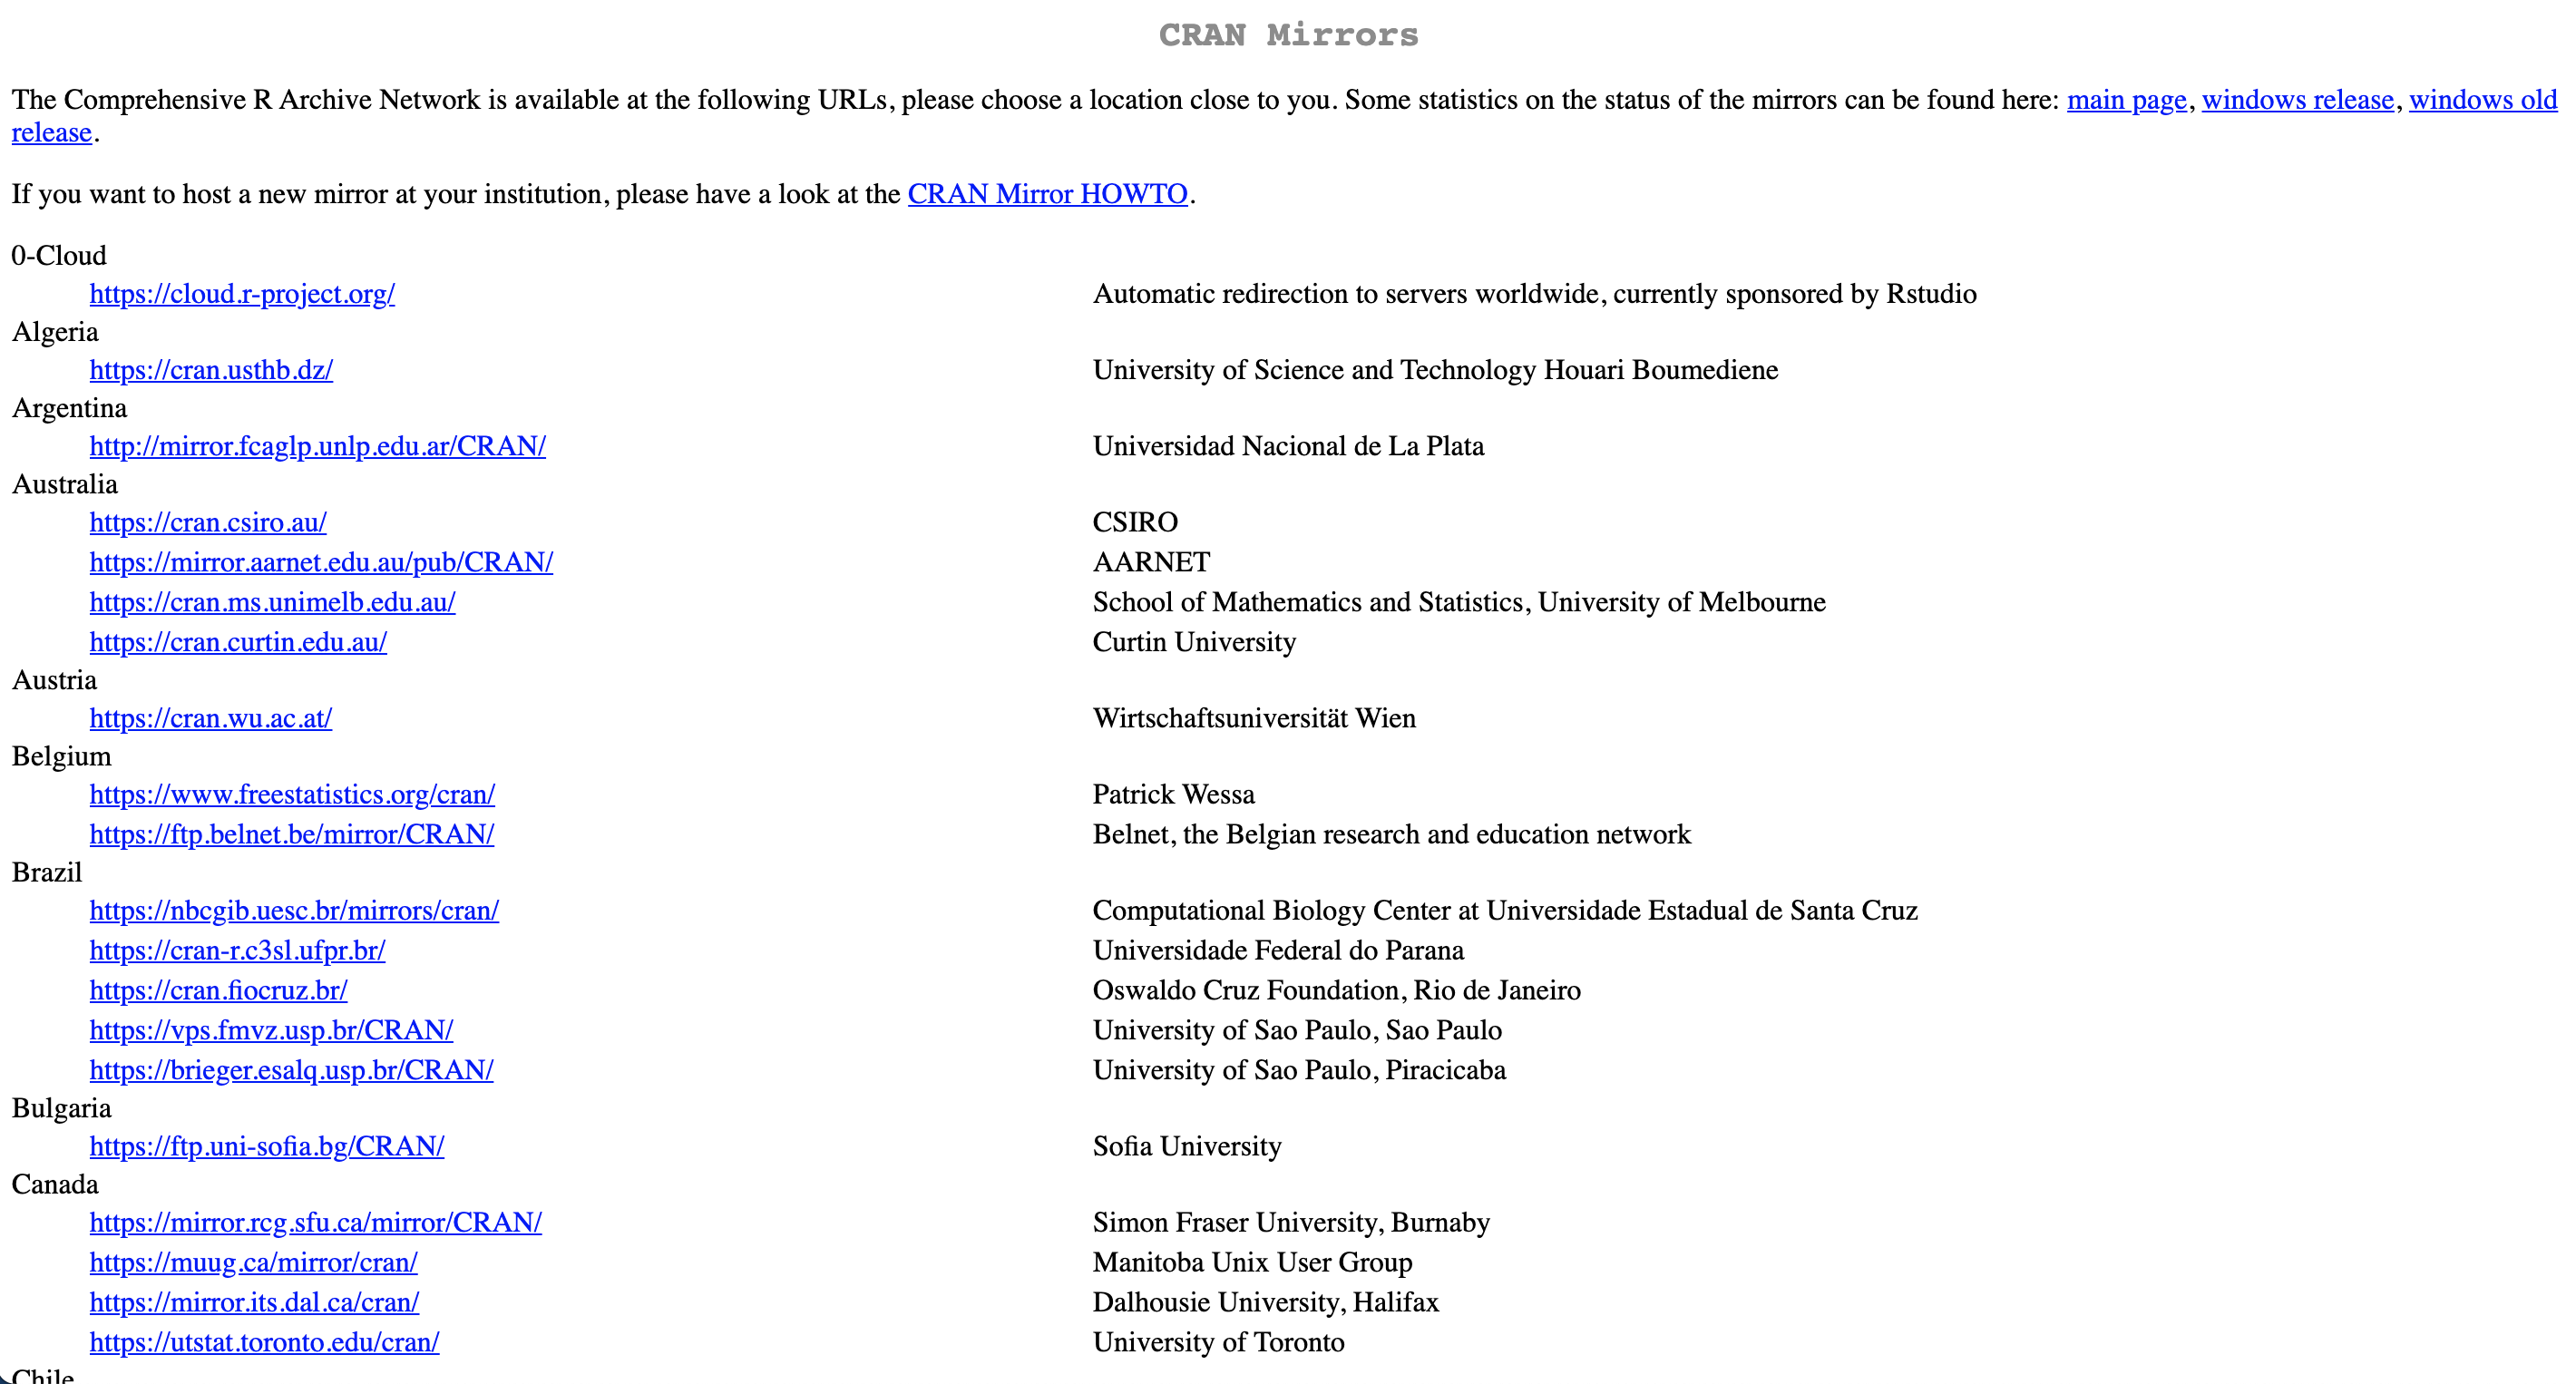
Download R from CRAN
Demo: https://www.r-project.org/
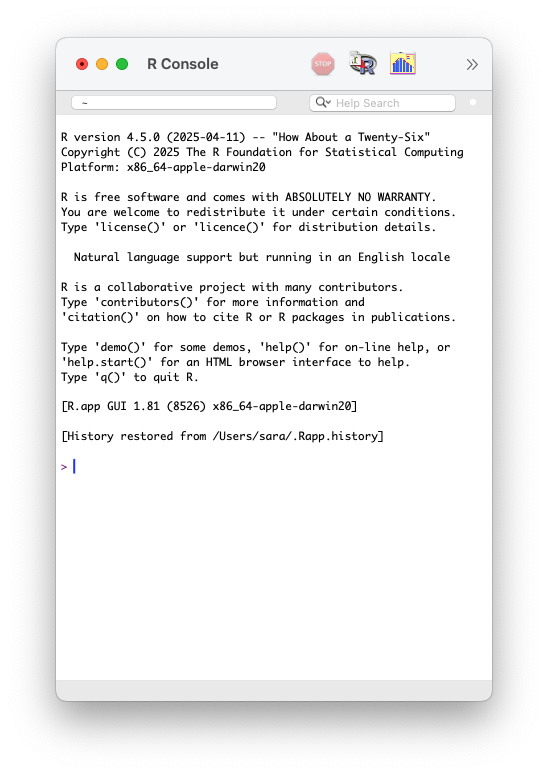
R Console
R version 4.6.0 (2026-04-24)
R name “Because it was There”
R licence “ABSOLUTELY NO WARRANTY”
R prompt
>
Workspace Image
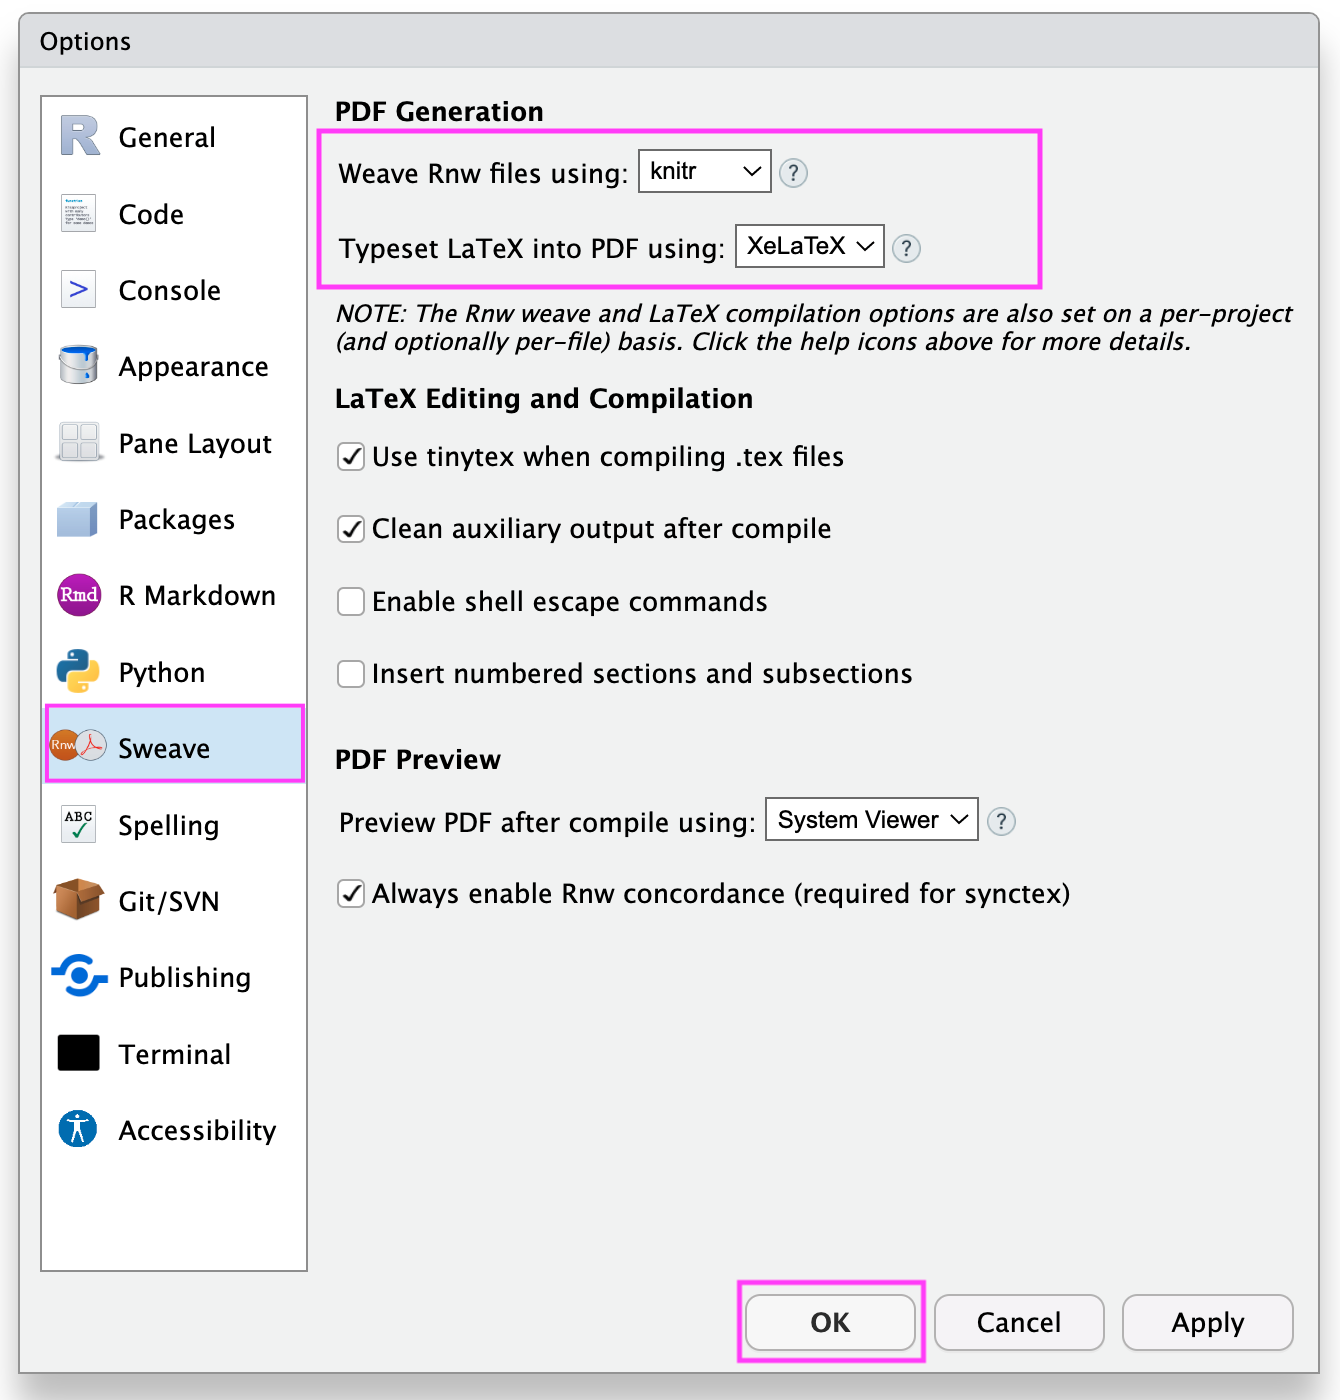
Don’t save workspace image
It helps in “freshly minted R sessions”.
“put more trust in your script than in your memory”.
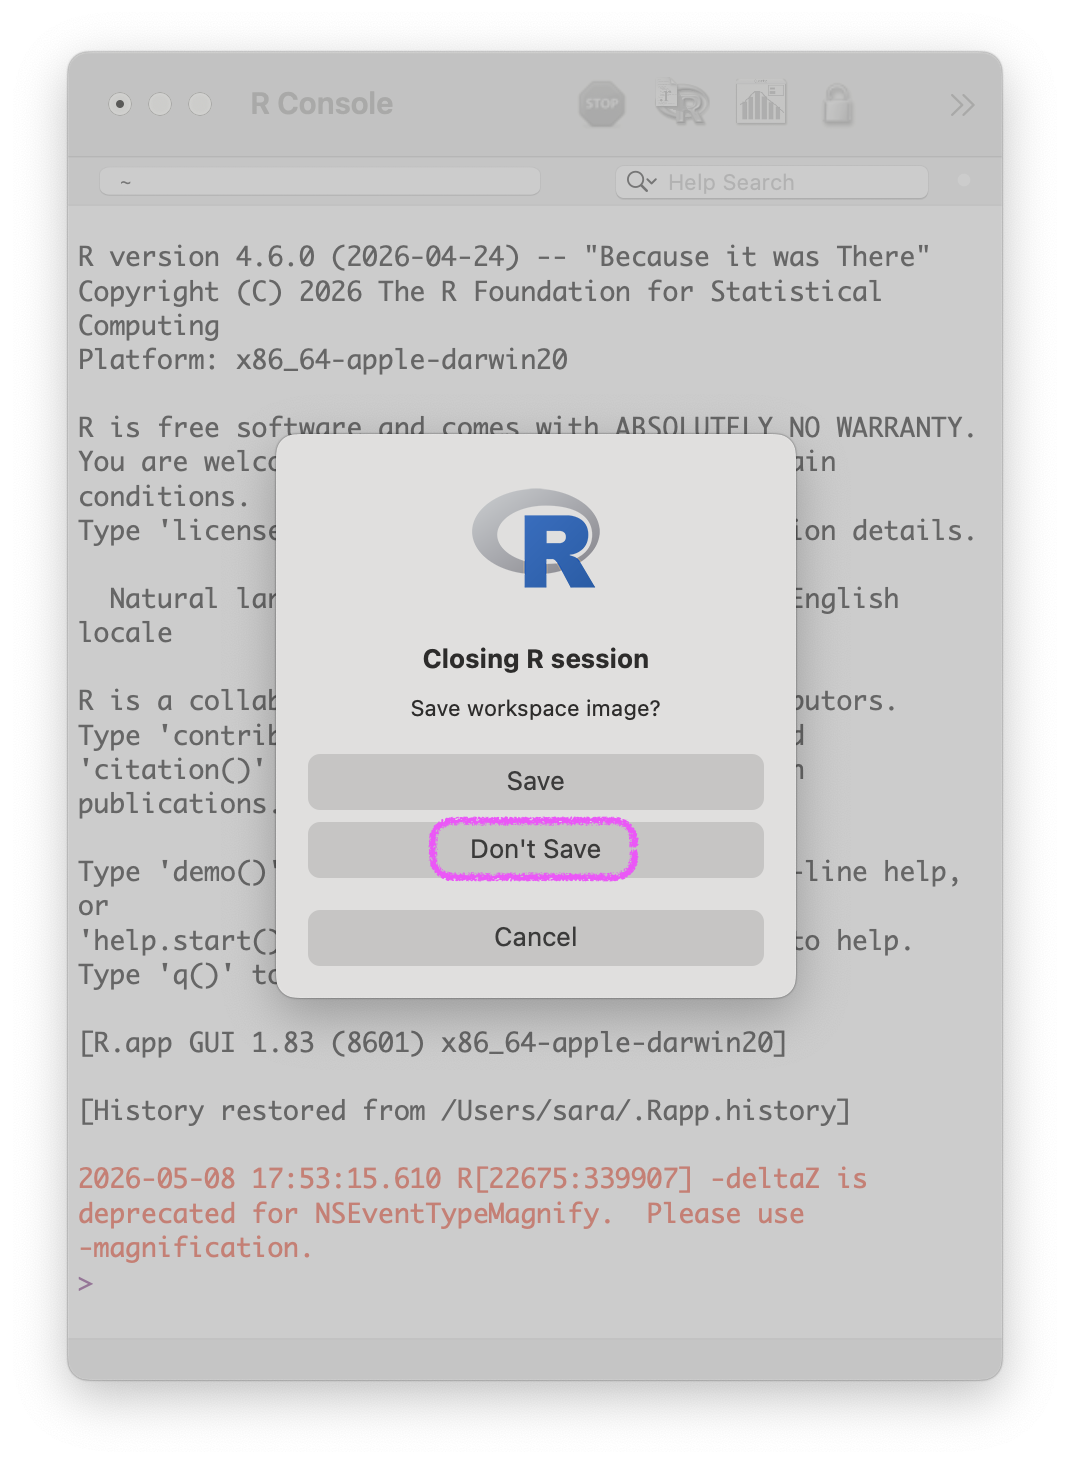
Source: R Bloggers
R Coding
Ways to Run R code
- Type code directly after the
>prompt and press Enter to run - Best for quick, one-line commands and experimenting
- Output appears immediately below your command
- Nothing is saved - closing R loses everything you typed
- Think of it as a scratch pad
- Write multiple lines of code in a plain text file saved as
.R - Code is saved and reusable - you can share it with others
- Output appears in the Console, plots appear in the Plots pane
- Mix R code chunks with text, headings, and images in one document
- Click
Renderto produce a final HTML, PDF, or Word report - Perfect for reproducible research and sharing your full analysis as a report
R Console
Code
Output
[1] 7Press Enter key to run the code in console
Copy code to clipboard
R Console: Addition
Operators
12 + 3 in this code + is an operator.
“Operators are used to perform operations on variables and values.”
Source: w3schools
Arithmetic Operators
“Arithmetic operators are used with numeric values to perform common mathematical operations.”
Put spaces between and around operators (
= + - * /)Increase screen font size for better view.
Arithmetic Operators
| Operator | Name | Example |
|---|---|---|
+ |
Addition | x + y |
- |
Subtraction | x - y |
* |
Multiplication | x * y |
/ |
Division | x / y |
^ |
Exponent | x ^ y |
%% |
Remainder | x %% y |
Source: w3schools
R Console: Subtraction
R Console: Multiplication
R Console: Division
R Console
R Comparison Operators
“Comparison operators are used to compare two values.”
R Comparison Operators
| Operator | Name | Example |
|---|---|---|
== |
Equal | x == y |
!= |
Not equal | x != y |
> |
Greater than | x > y |
< |
Less than | x < y |
>= |
Greater than or equal to | x >= y |
<= |
Less than or equal to | x <= y |
Source: w3schools
R Console
R Console
R Miscellaneous Operator
“Miscellaneous operators are used to manipulate data.”
Source: w3schools
What if we want to add all these values in R?
[1] 12 13 14 15 16 17 18 19 20 21 22 23 24 25 26 27 28 29 30 31 32 33 34 35 36R Functions
R Function
A function is a shortcut for a task we do repeatedly.
“A function, in a programming environment, is a set of instructions.”
R Function sum()
Structure of a R function
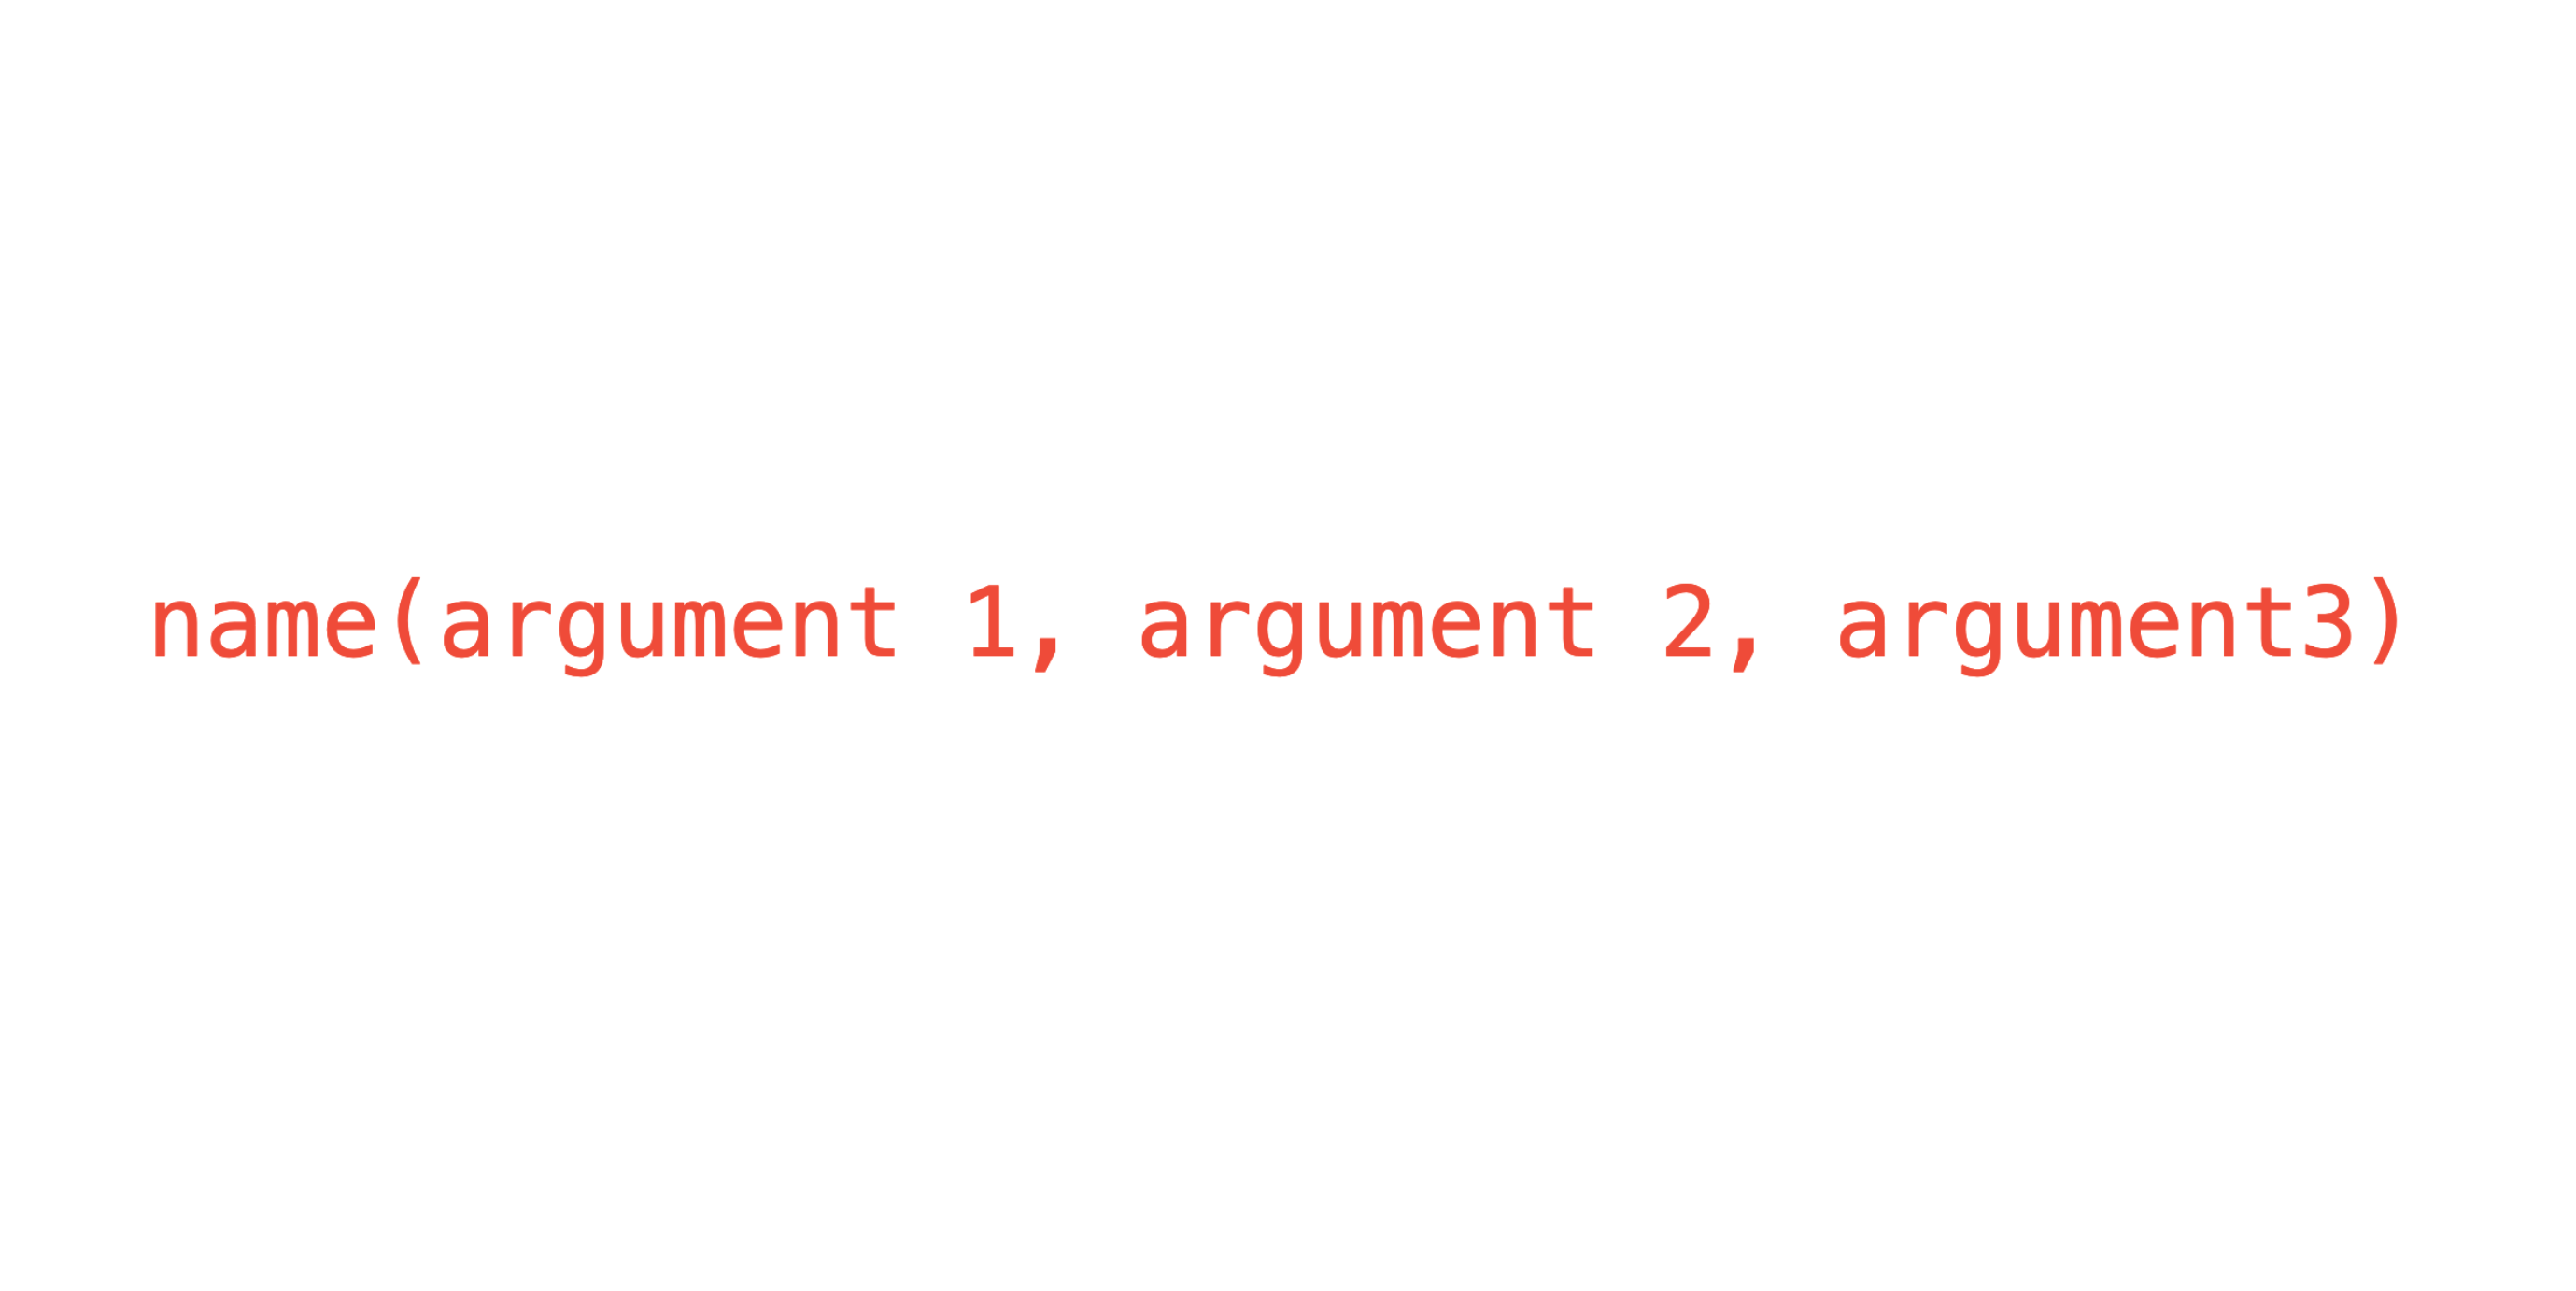
Structure of a R function
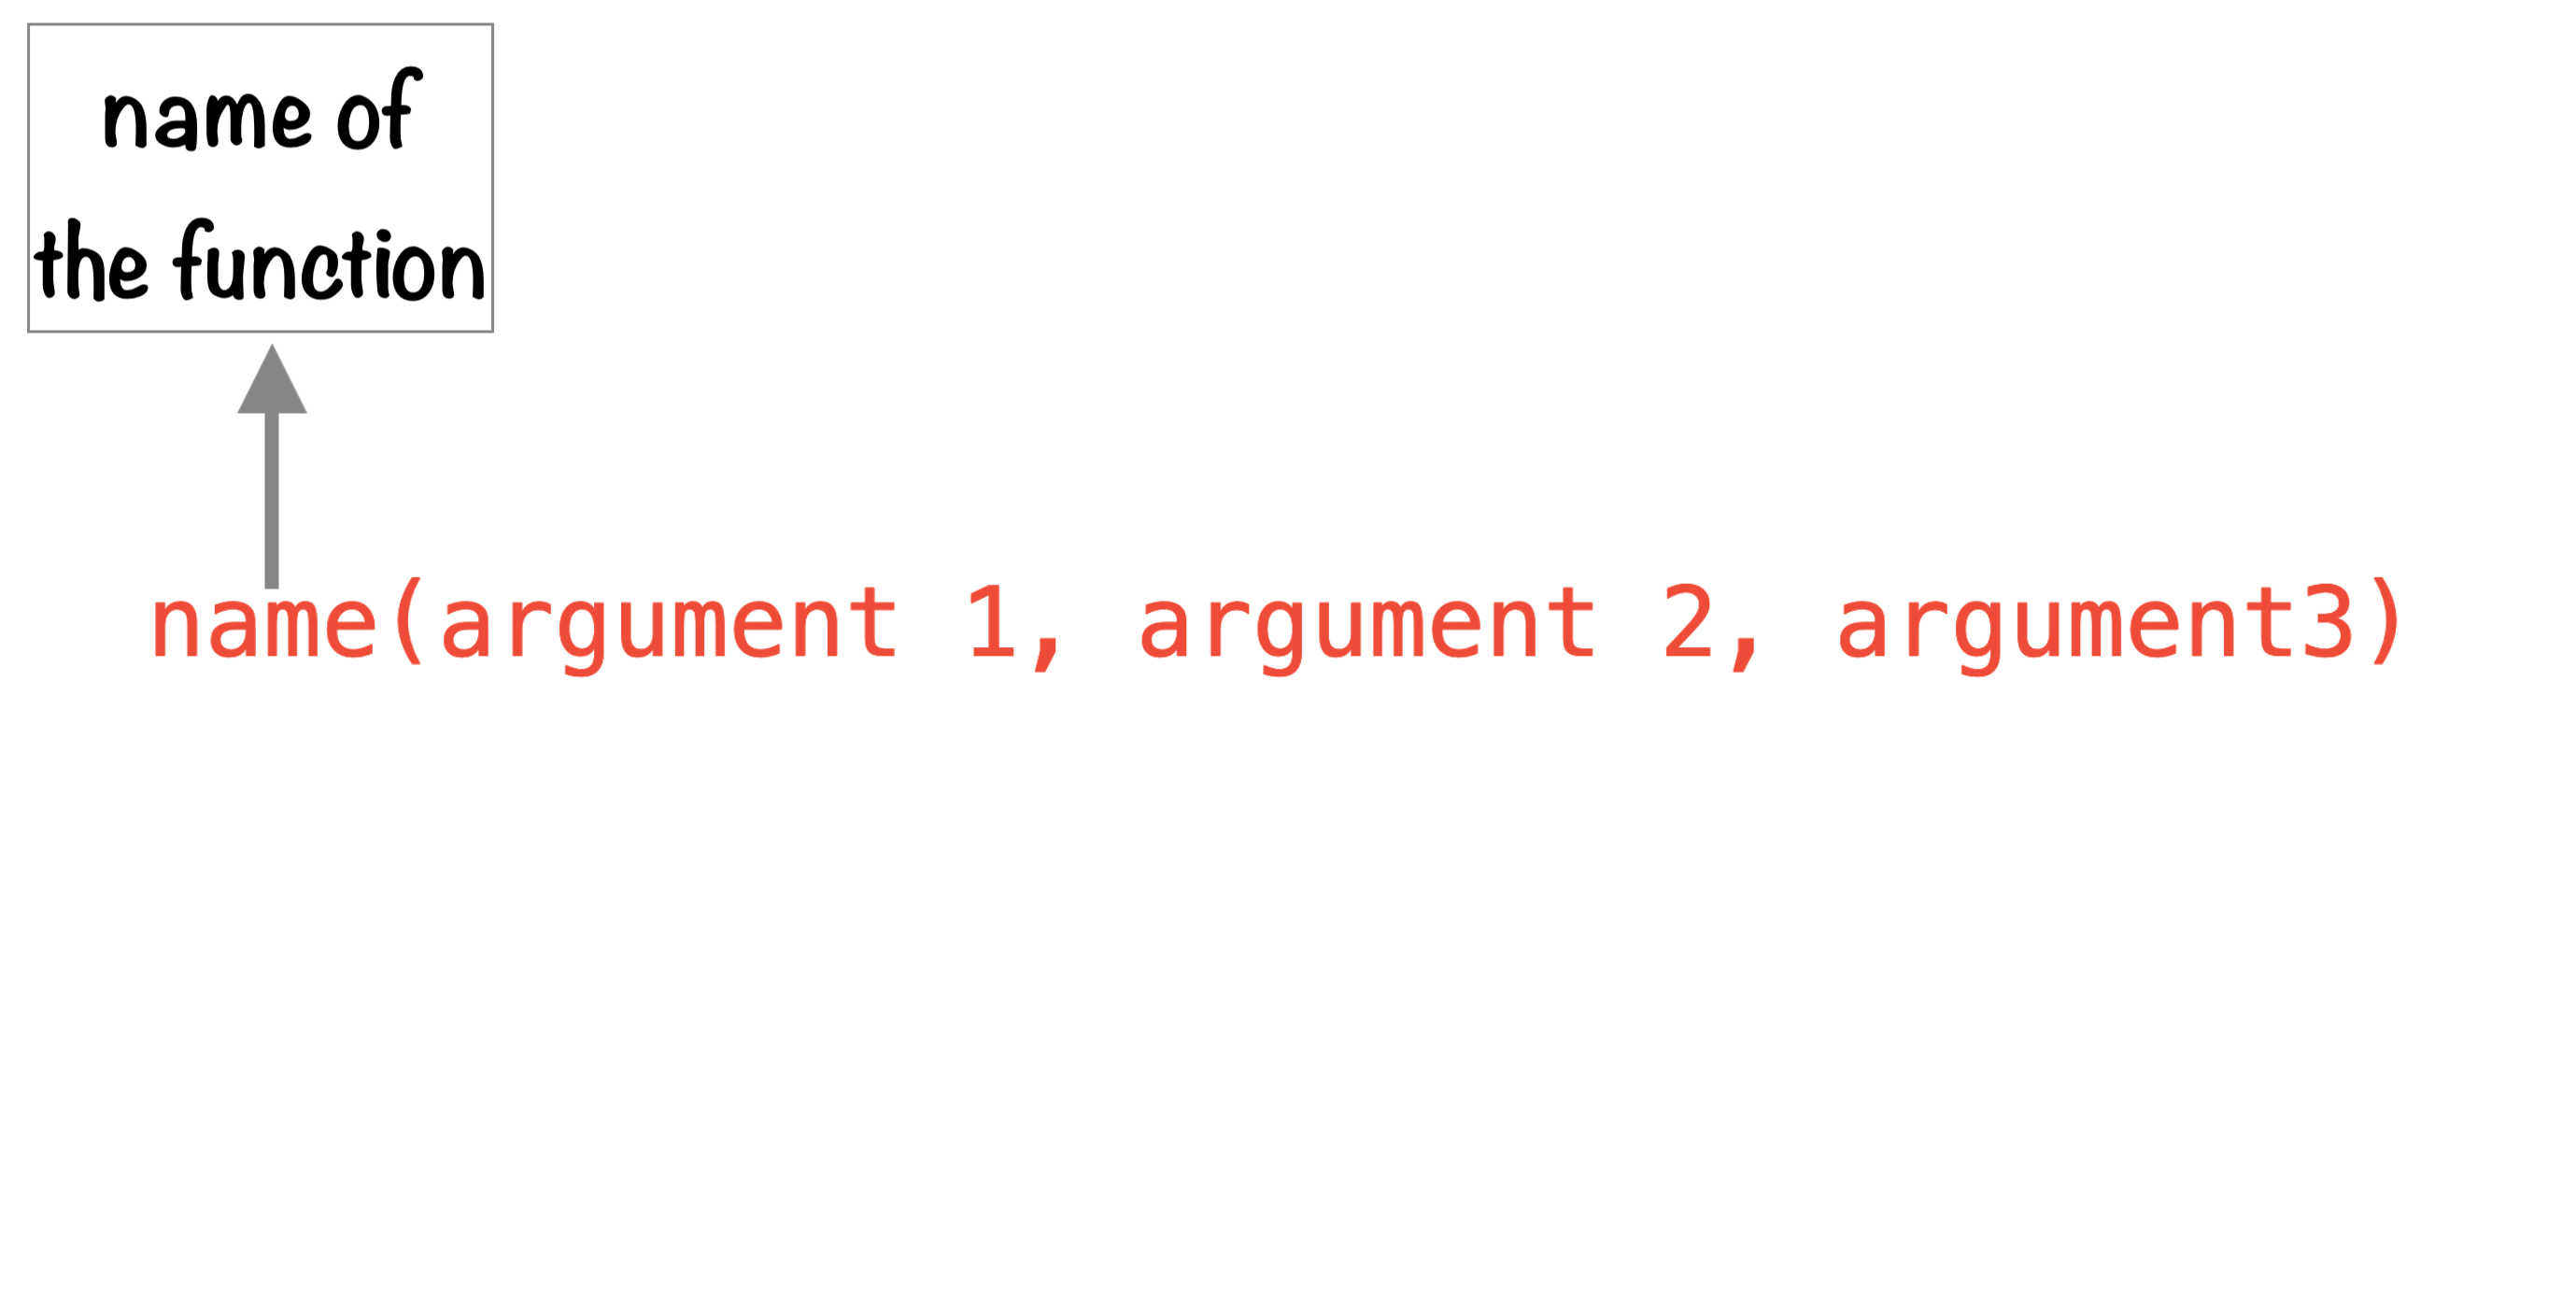
Structure of a R function
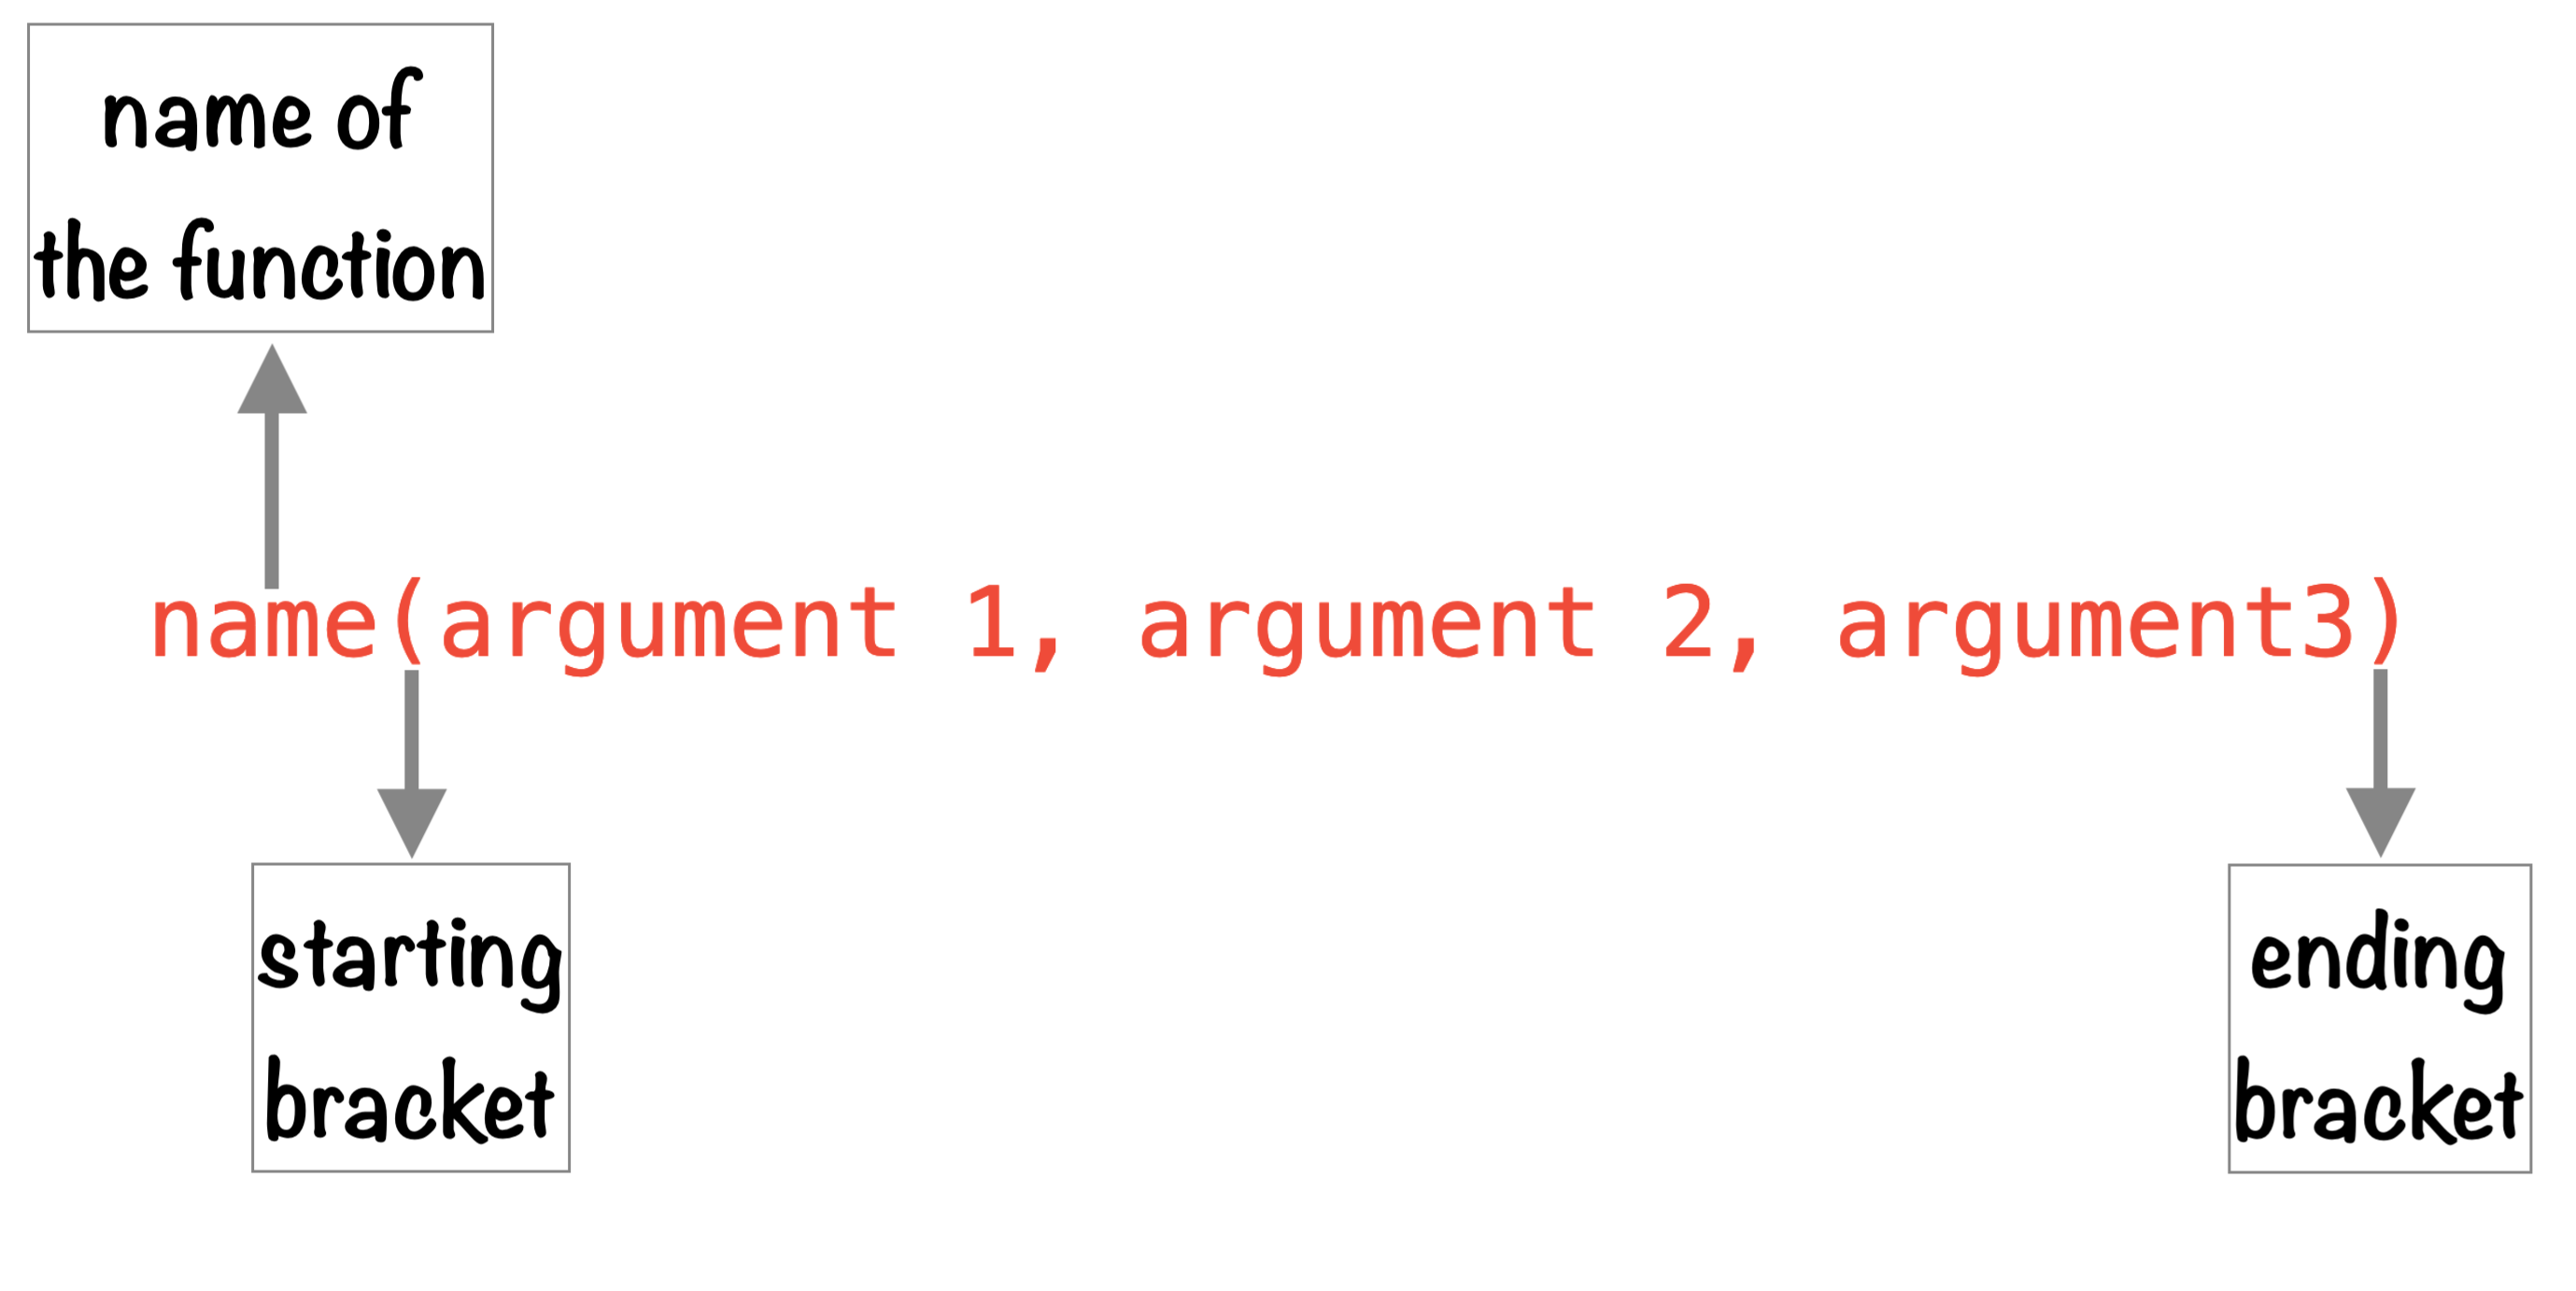
Structure of a R function
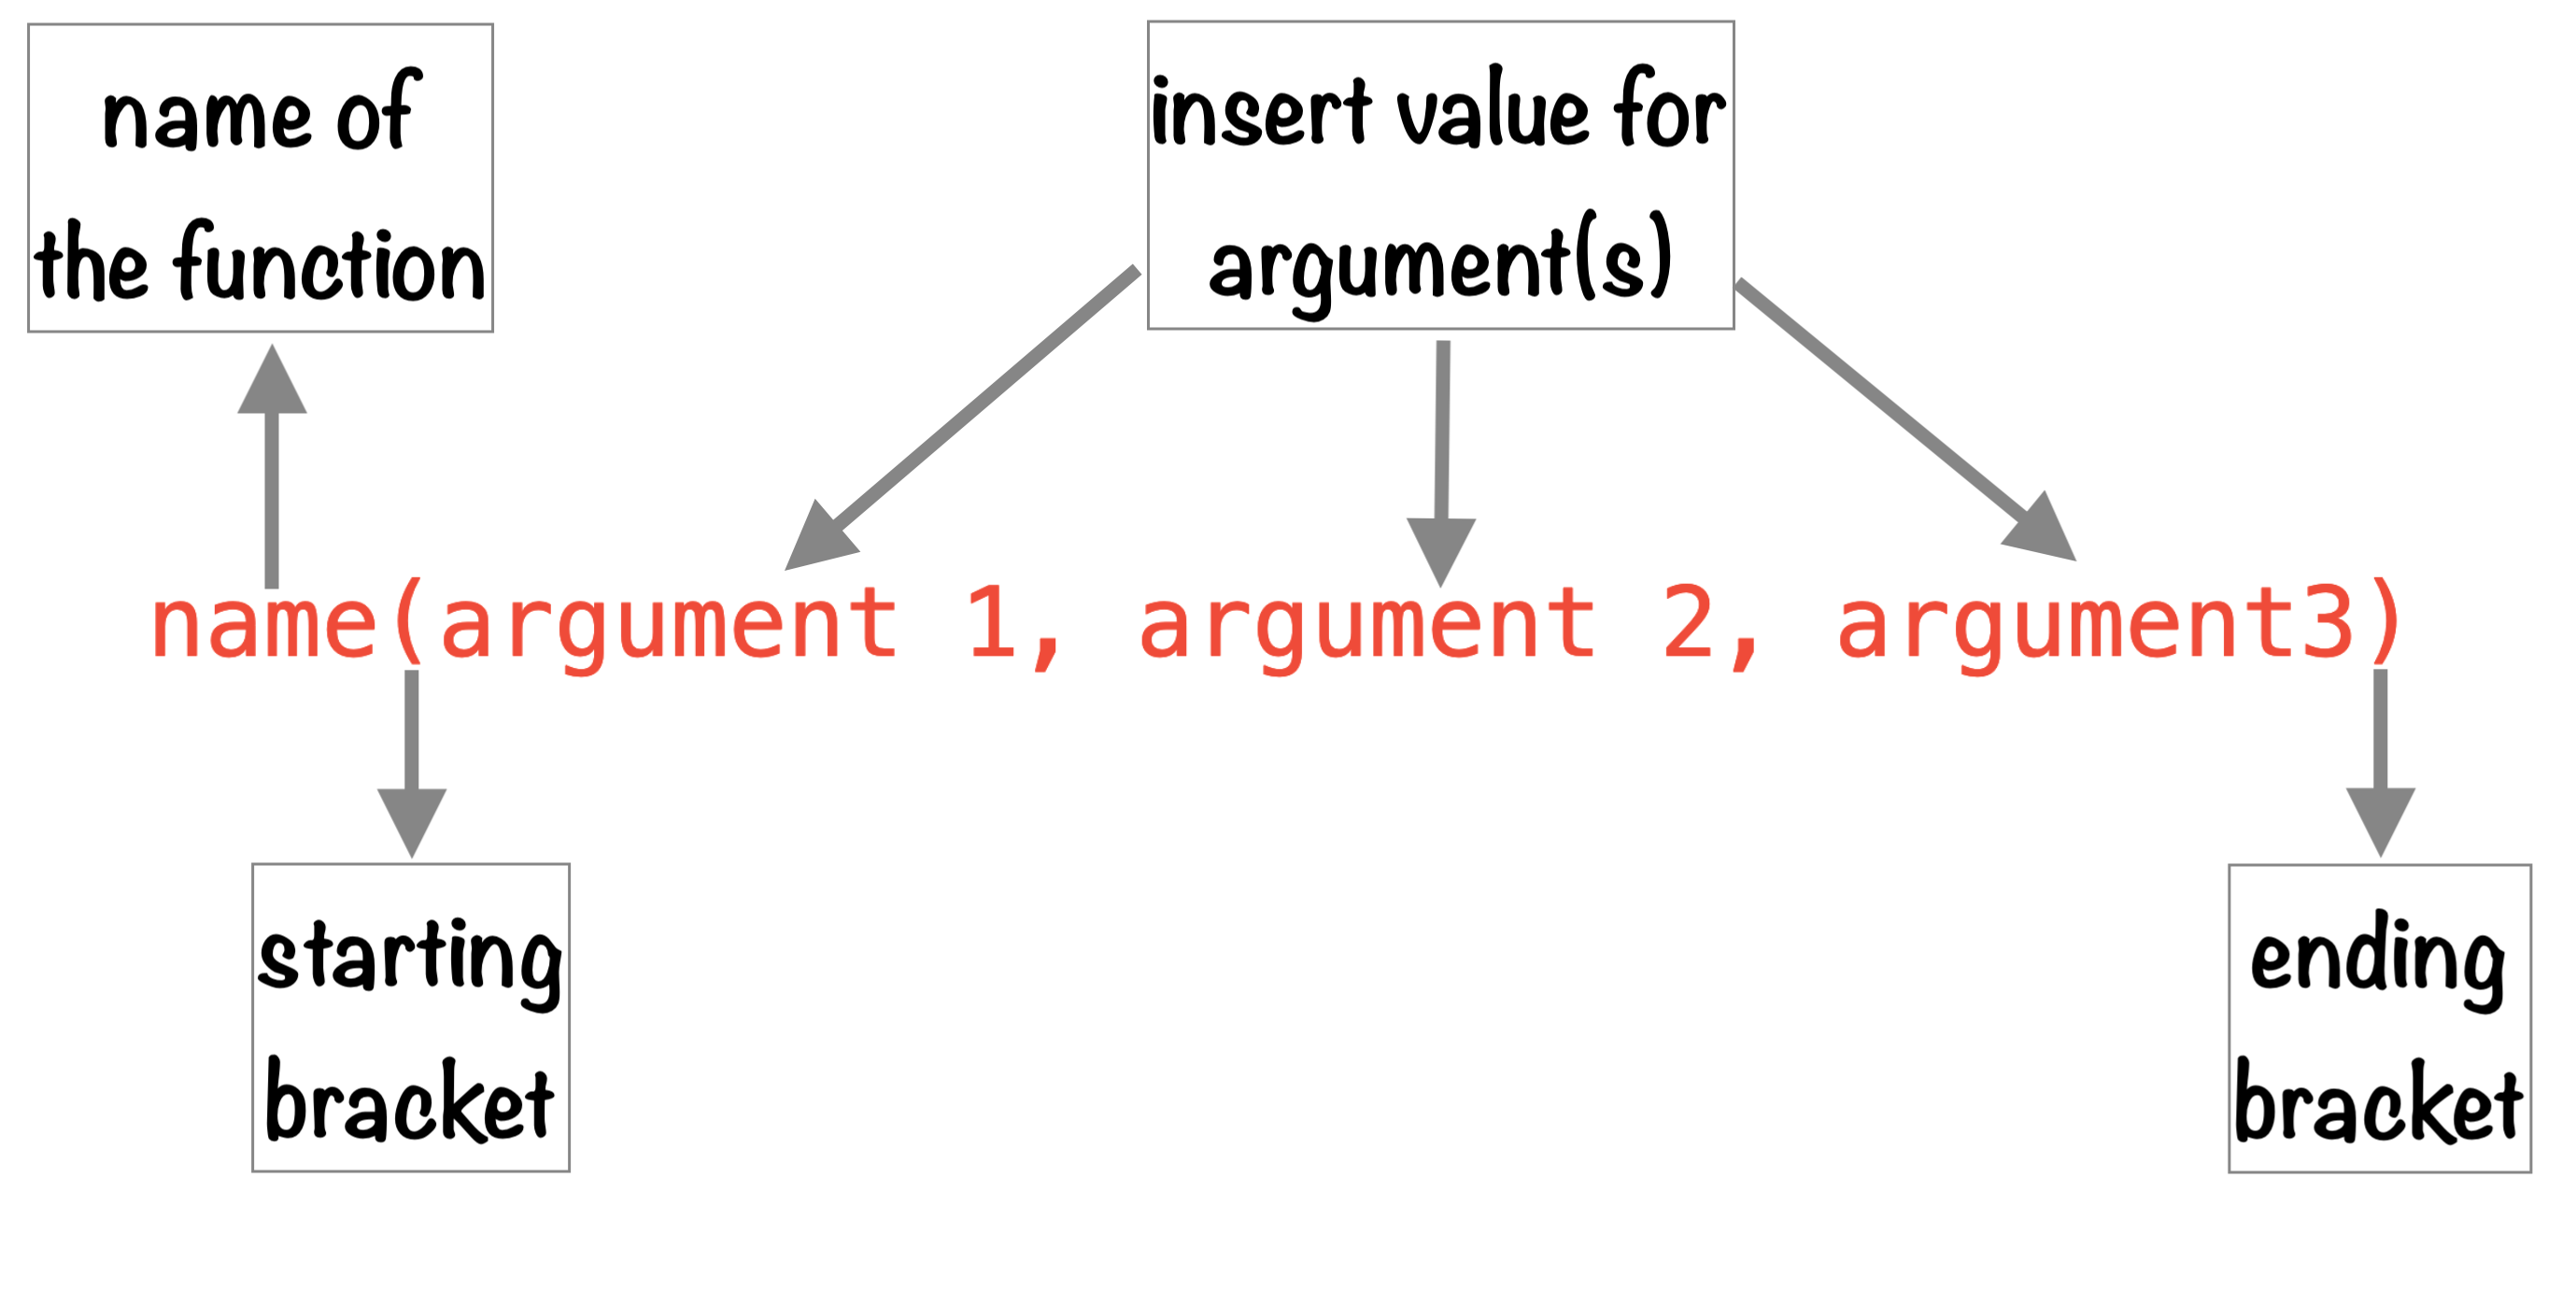
Structure of a R function
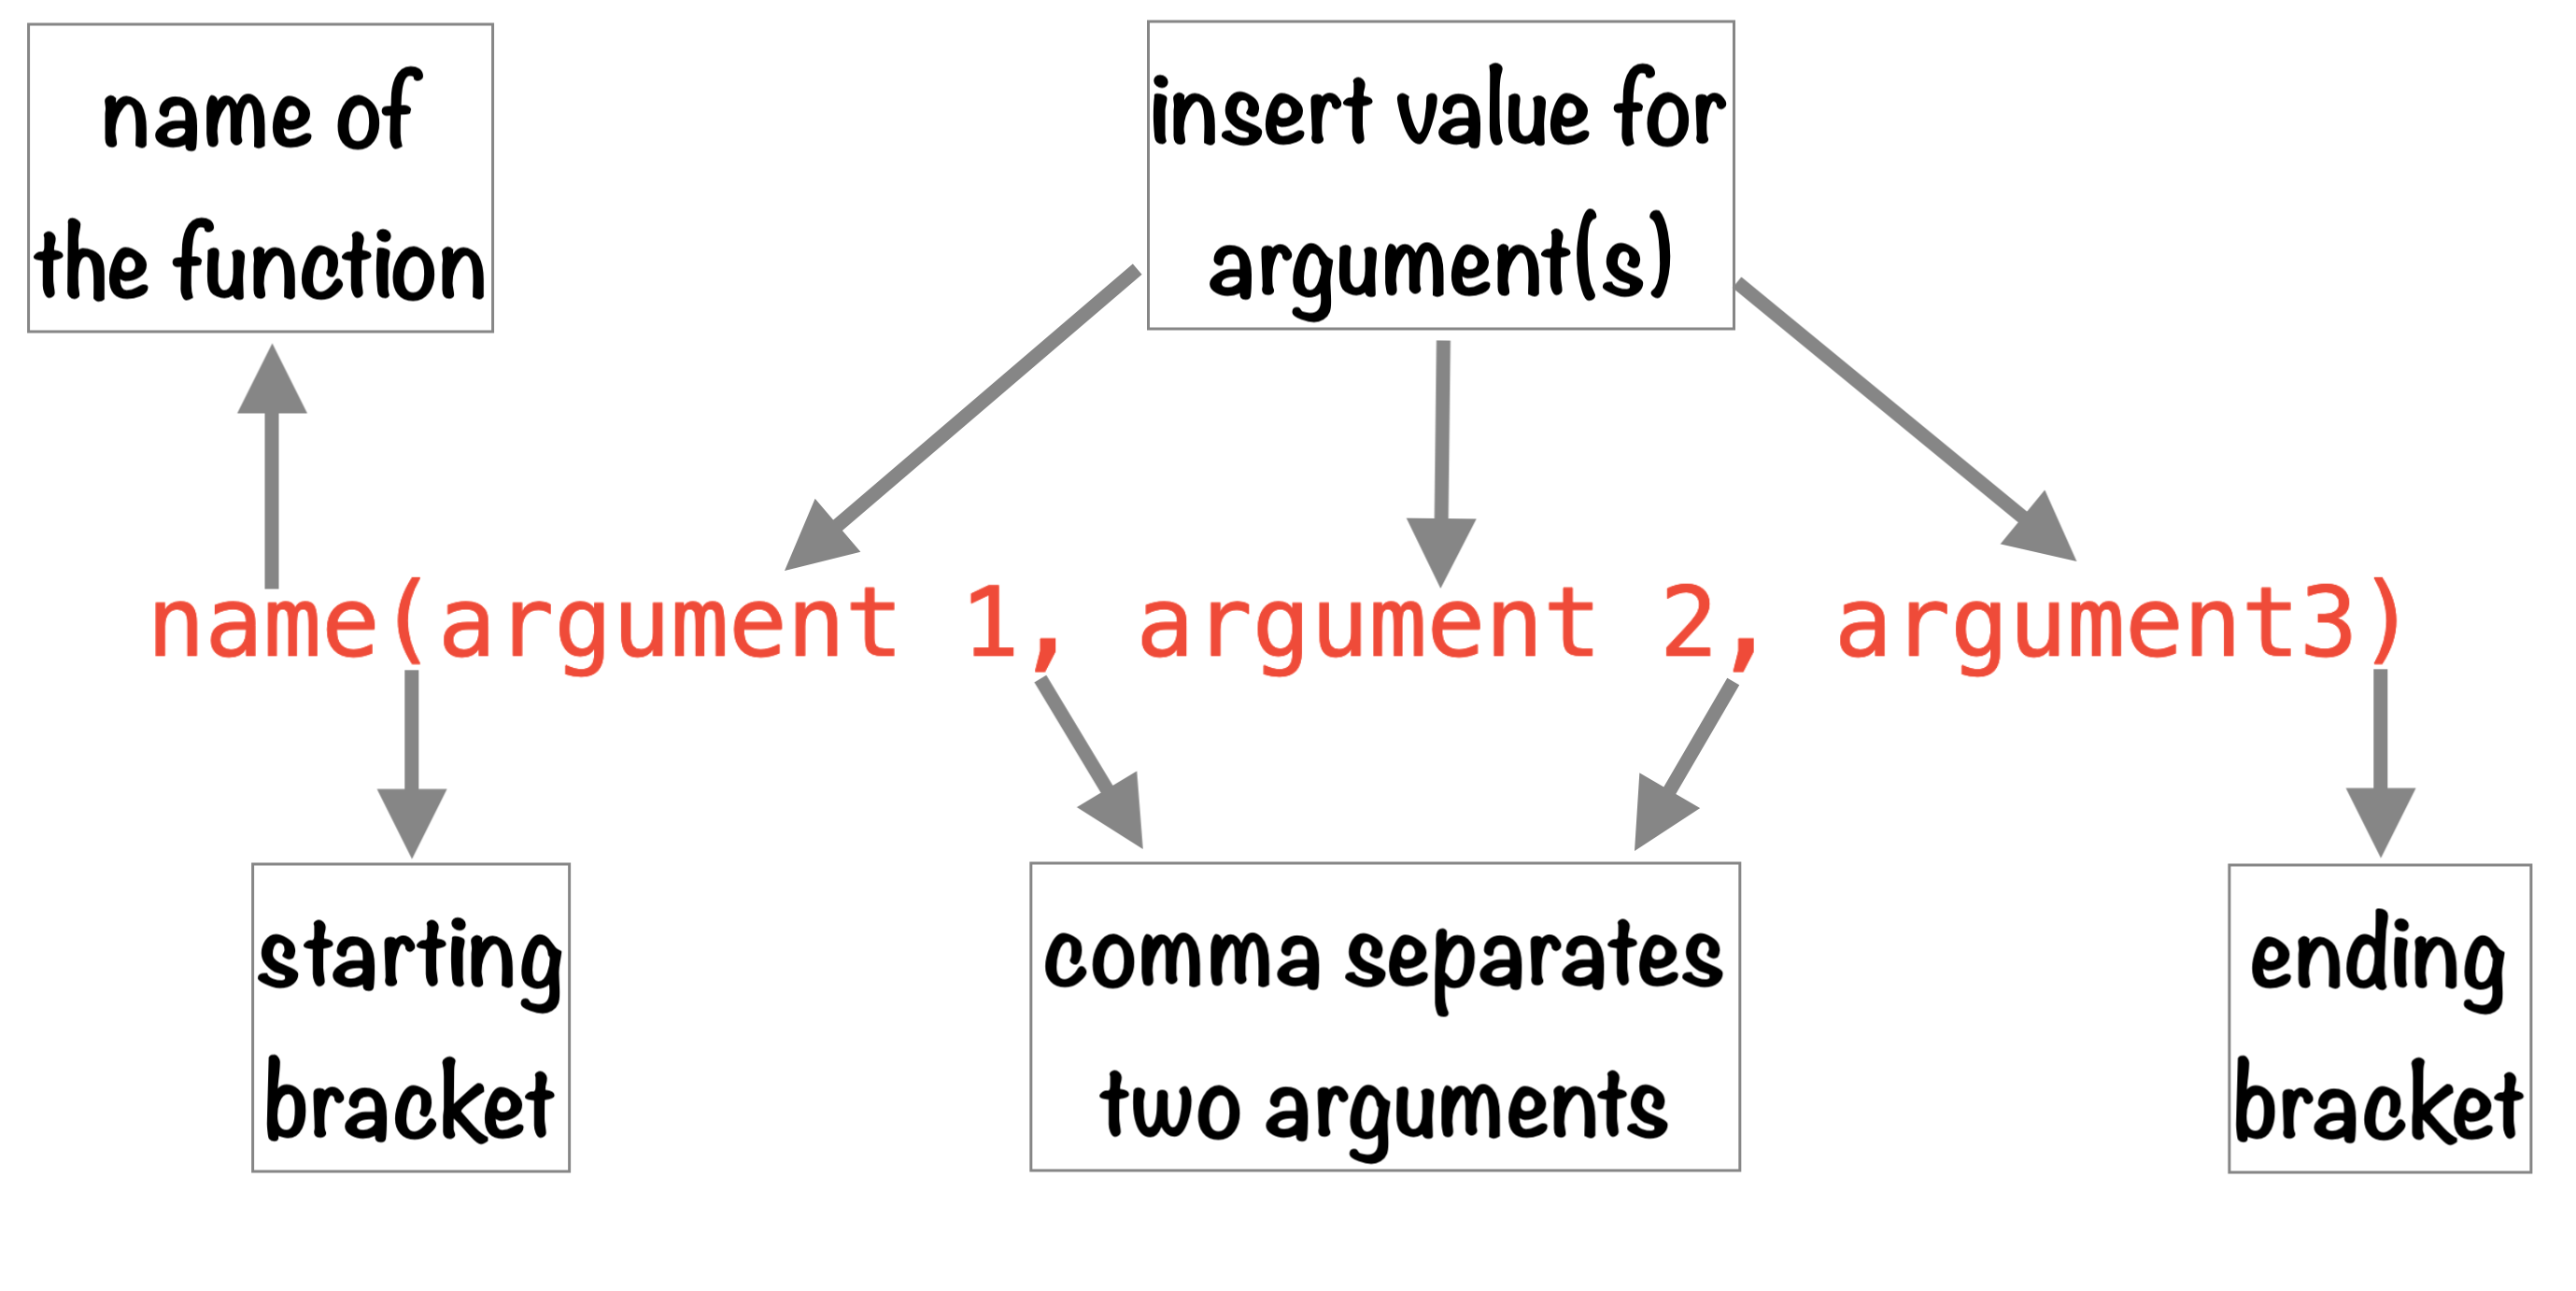
R Function sum()
Round function
Round function
Square Root Function
Sequence Function
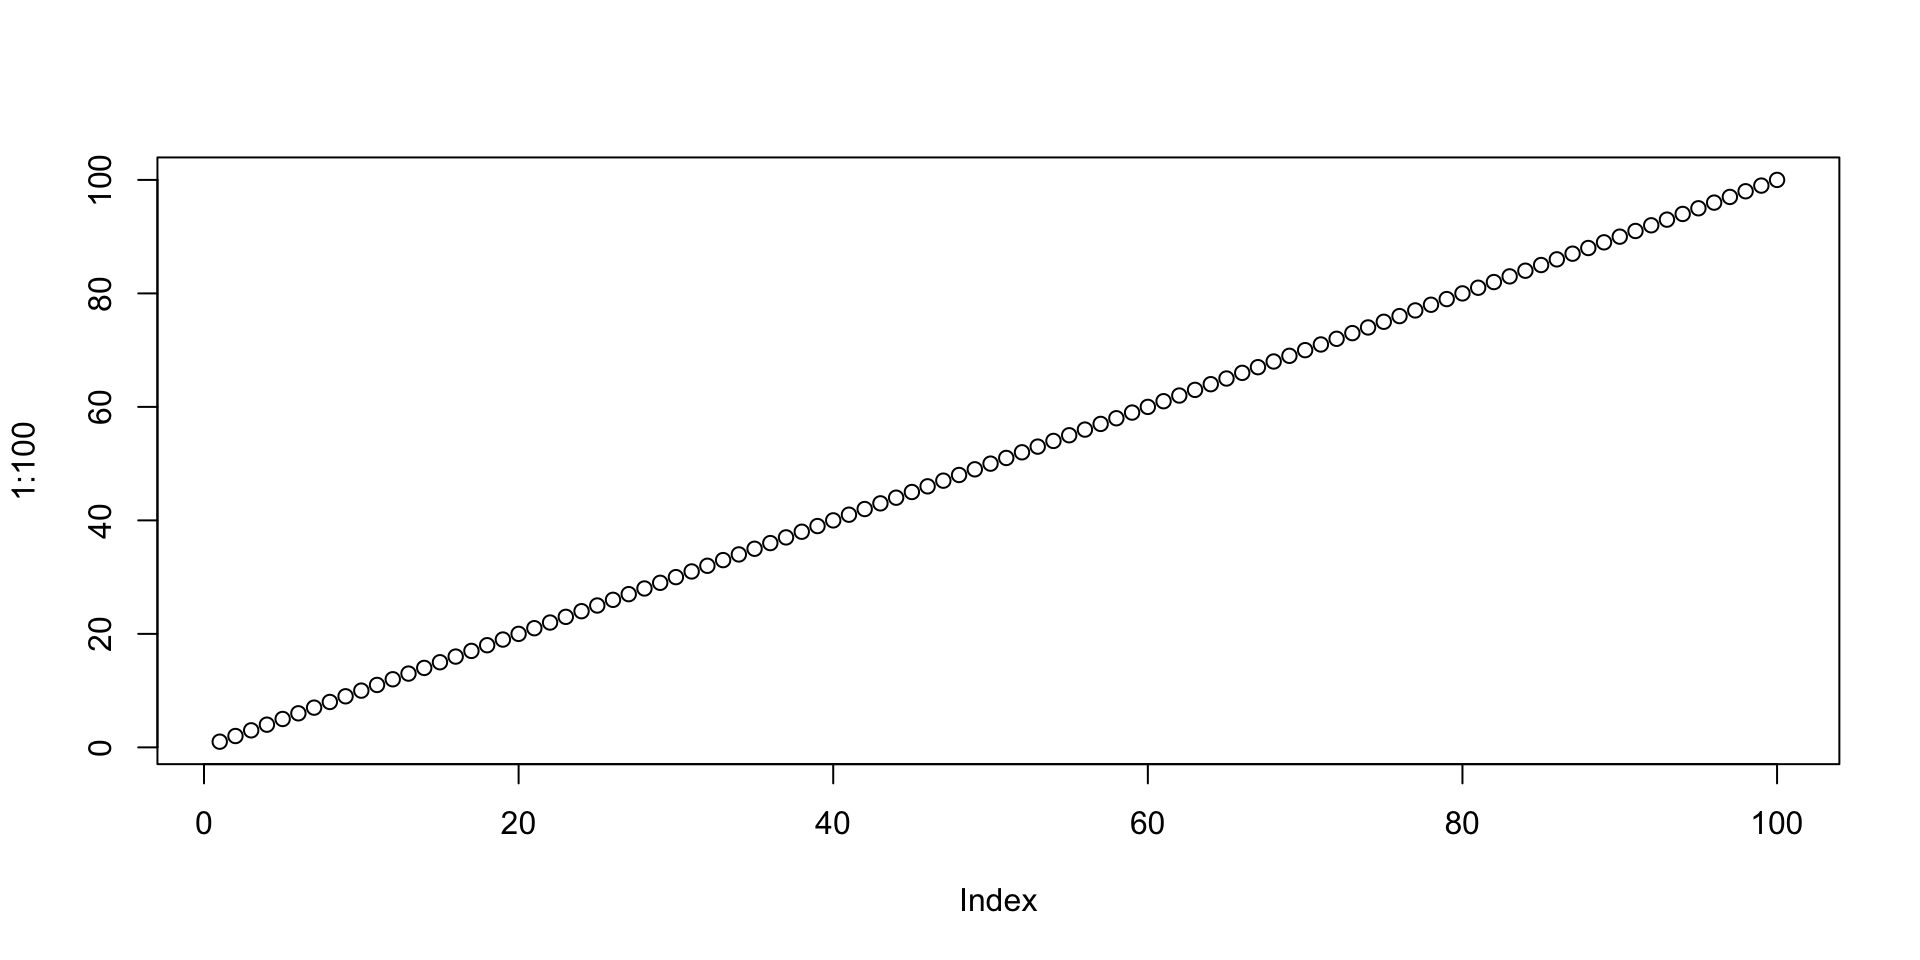
Plot using R
Getting Help with R
The
help()function and?help operator in R.Use
args()function to the get the list of arguments of a function.
Your Turn
Add two numbers: 15 + 27
Create a sequence of numbers from 1 to 10
Create a sequence from 5 to 50, interval by 5
Find the square root of 81
Round the number 3.786 to 2 decimal places
Answers
Add two numbers: 15 + 27,
15 + 27Create a sequence of numbers from 1 to 10,
seq(1, 10)Create a sequence from 5 to 50, interval of 5,
seq(5, 50, by = 5)Find the square root of 81,
sqrt(81)Round the number 3.786 to 2 decimal places,
round(3.786, 2)
😏 That’s okay but how to …
Everything in one Software codes, results, writing.
Always reproducible re-run work, anytime, by anyone.
Share and publish with other Word, PDF or HTML.

We need a superhero 🐾 RStudio
RStudio IDE

RStudio is an integrated development environment (IDE) for R and Python from company posit
R and RStudio
Imagine R as a powerful engine
and RStudio as a stylish car
Download RStudio: https://posit.co/download/rstudio-desktop
RStudio IDE
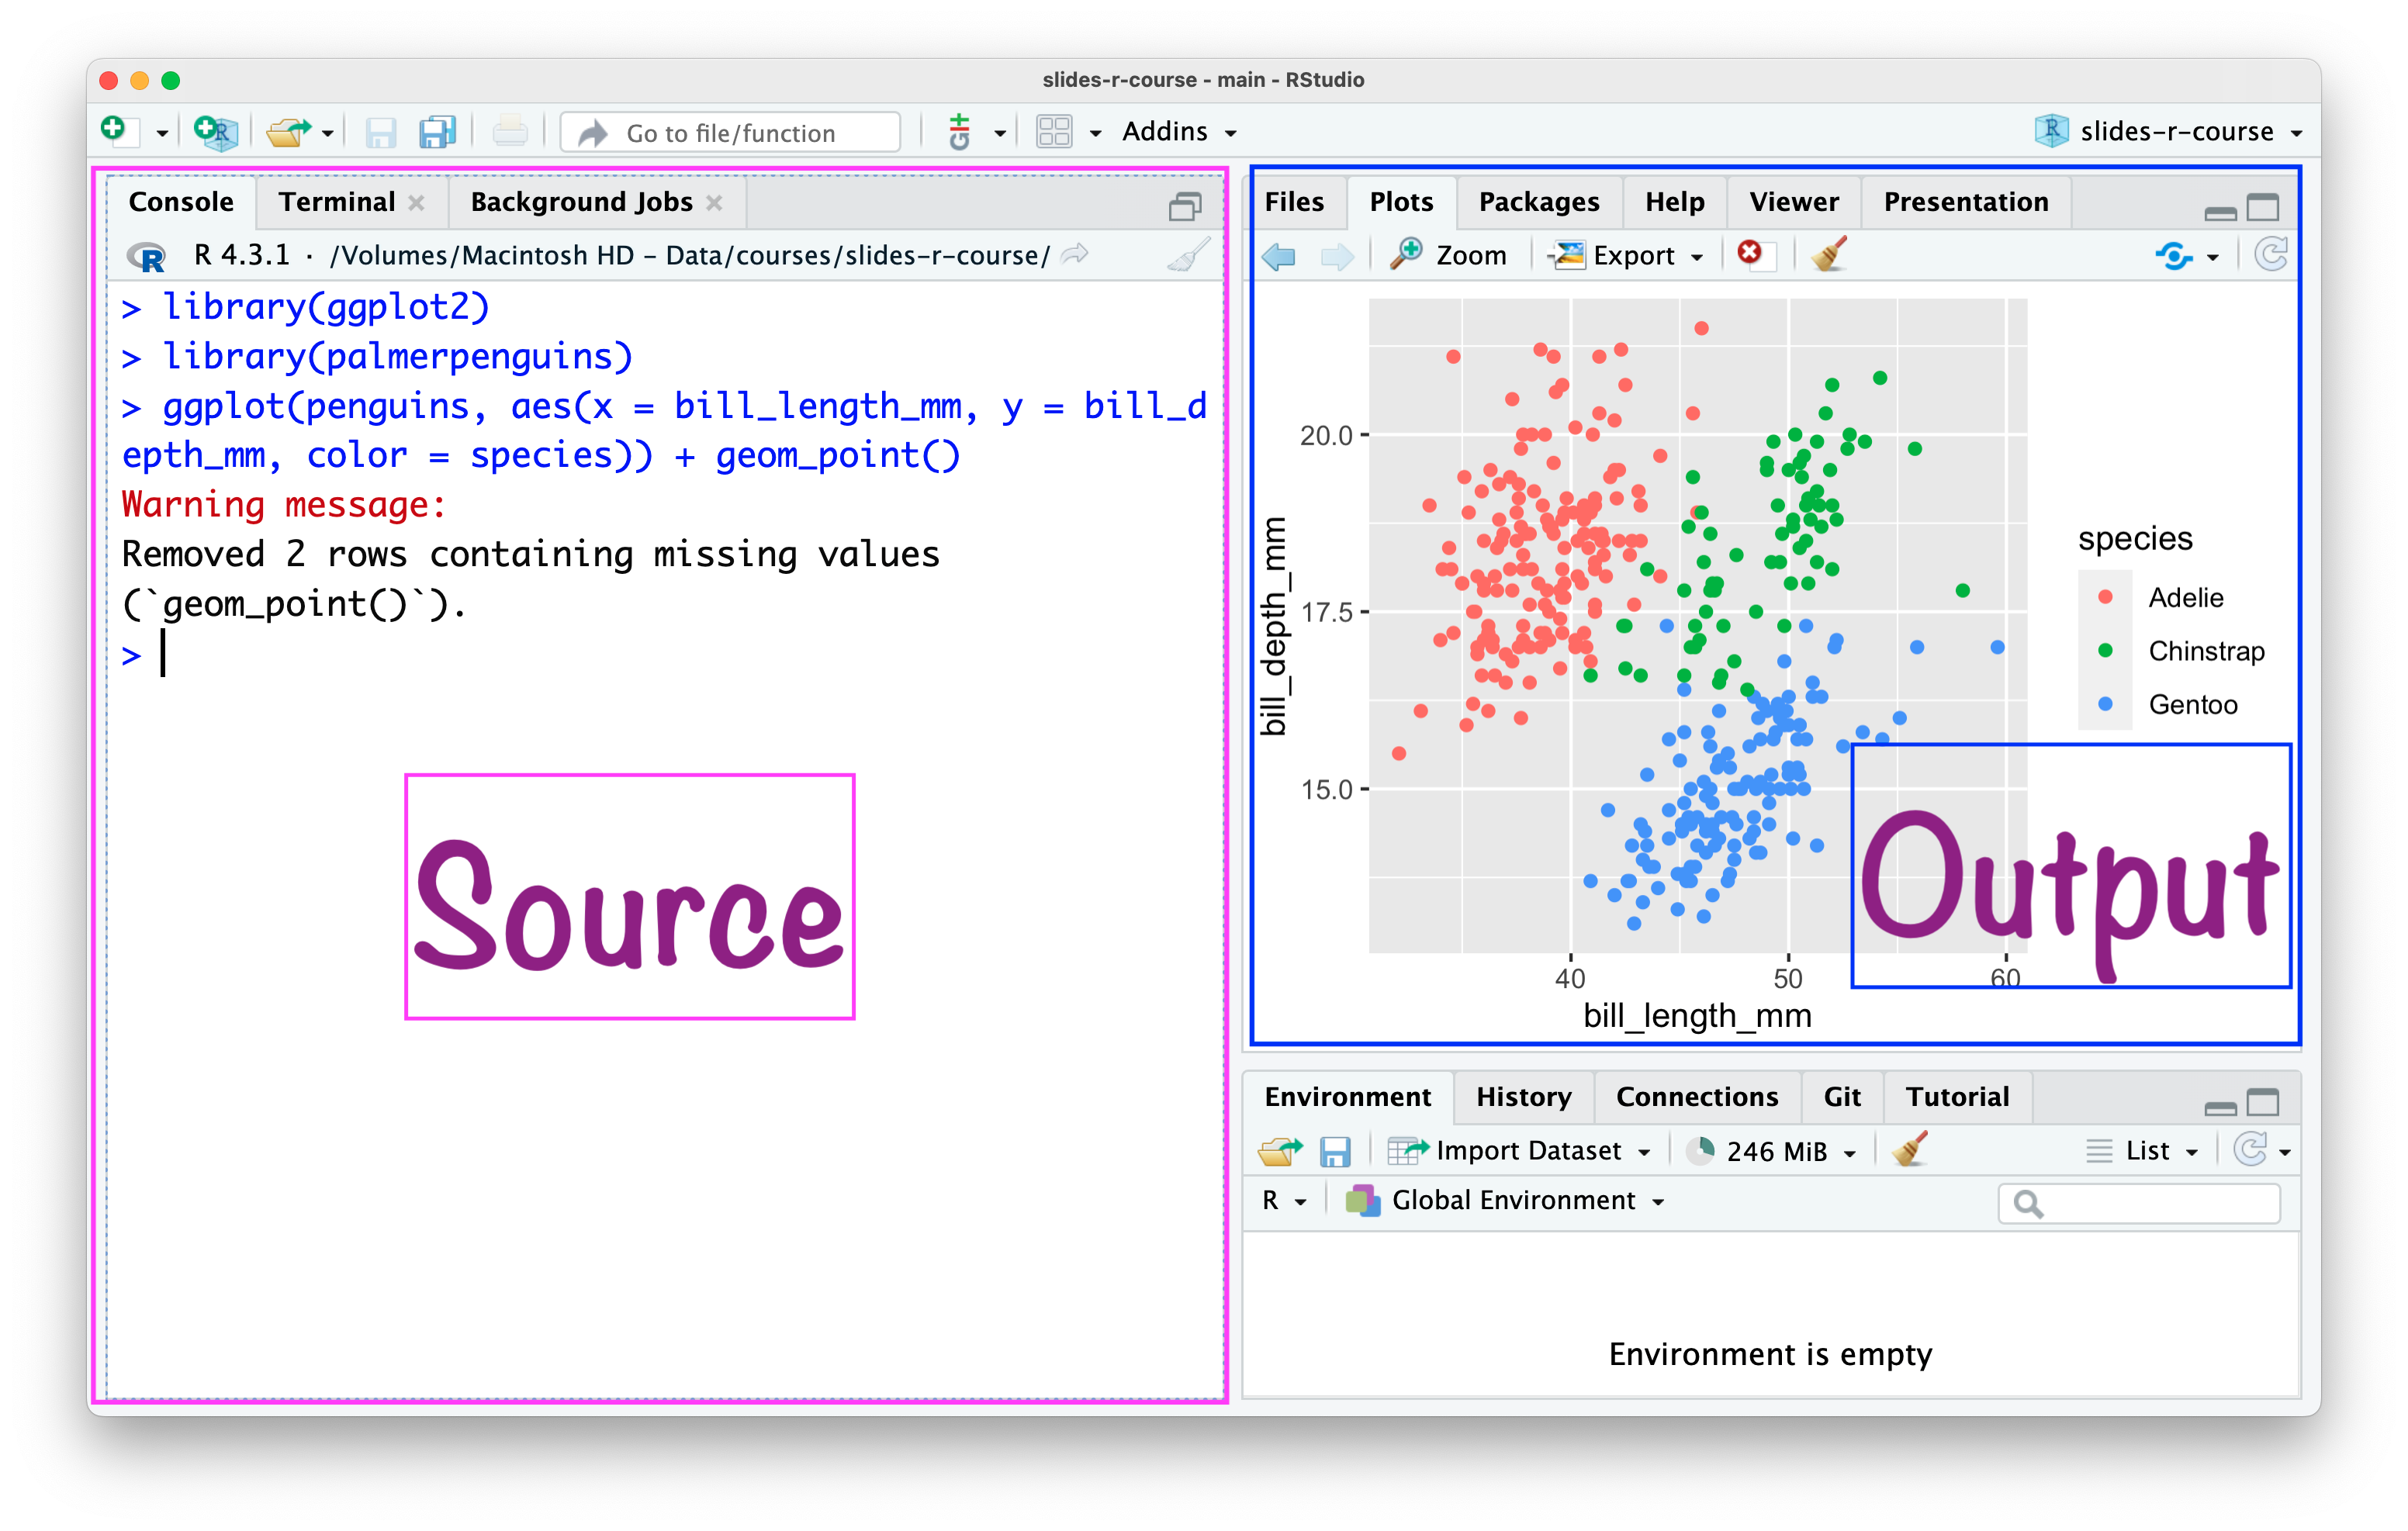
RStudio \(\rightarrow\) Tools \(\rightarrow\) Global Options
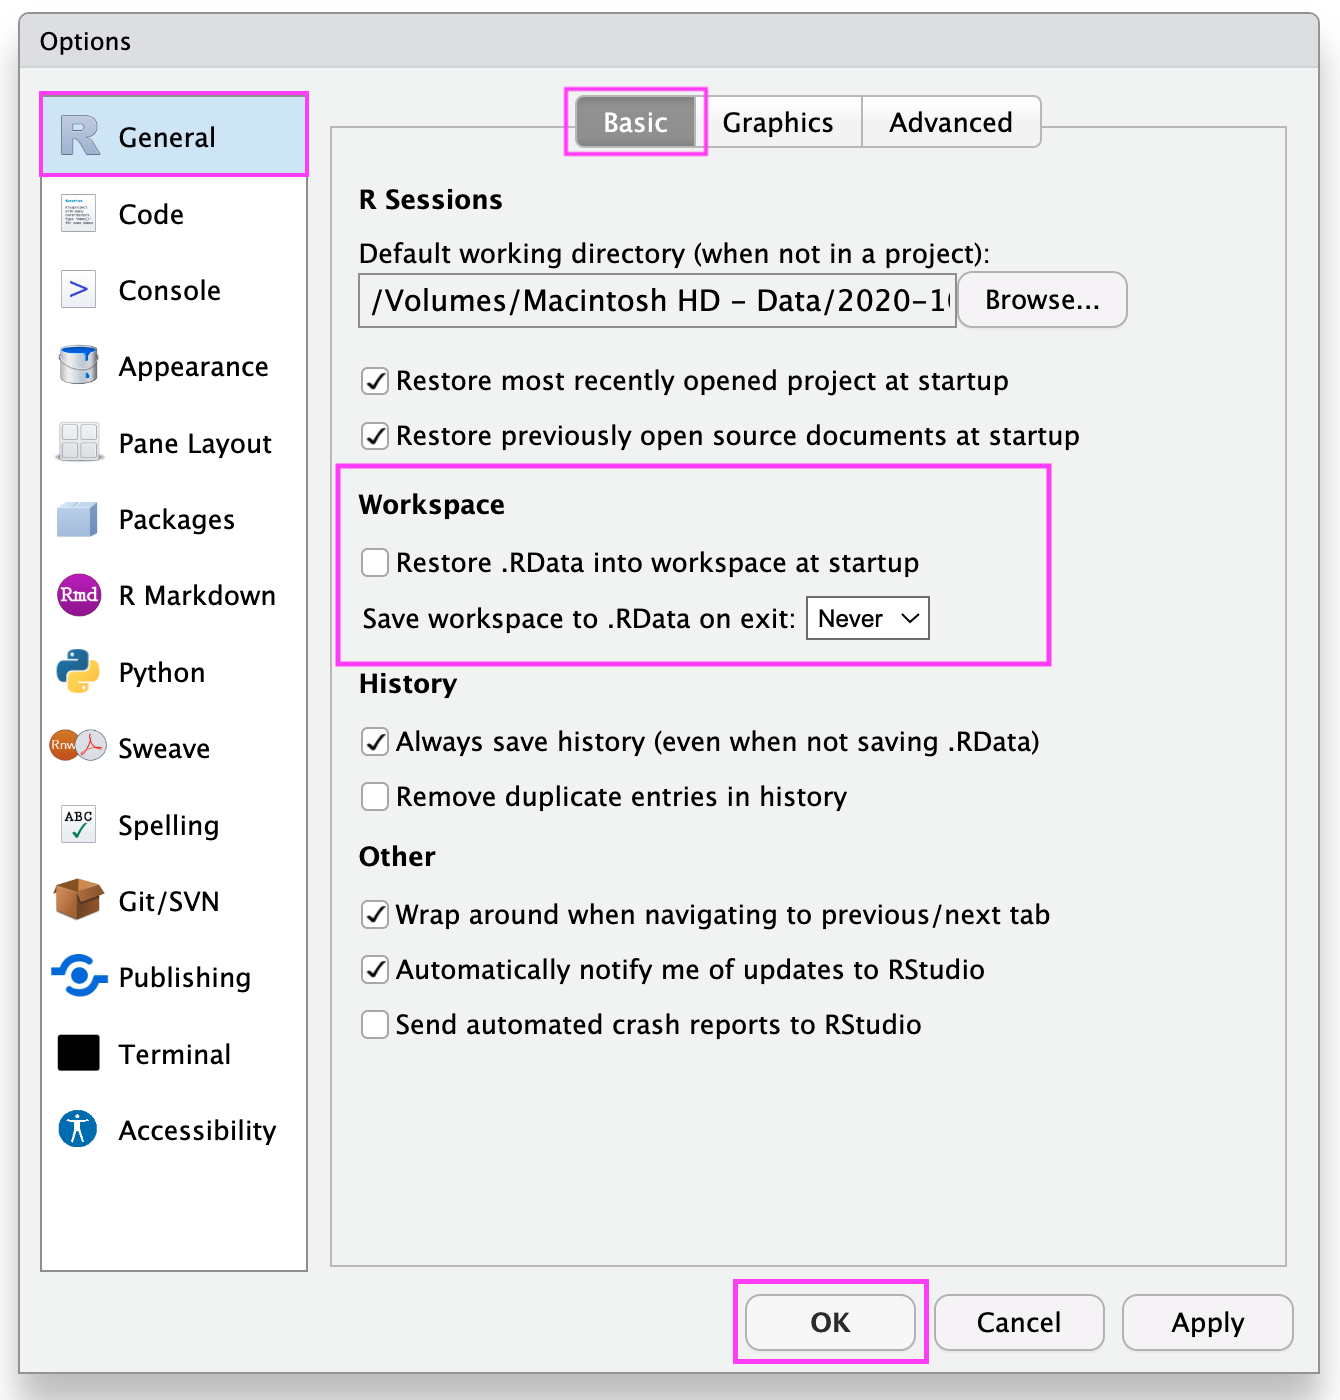
RStudio \(\rightarrow\) Tools \(\rightarrow\) Global Options
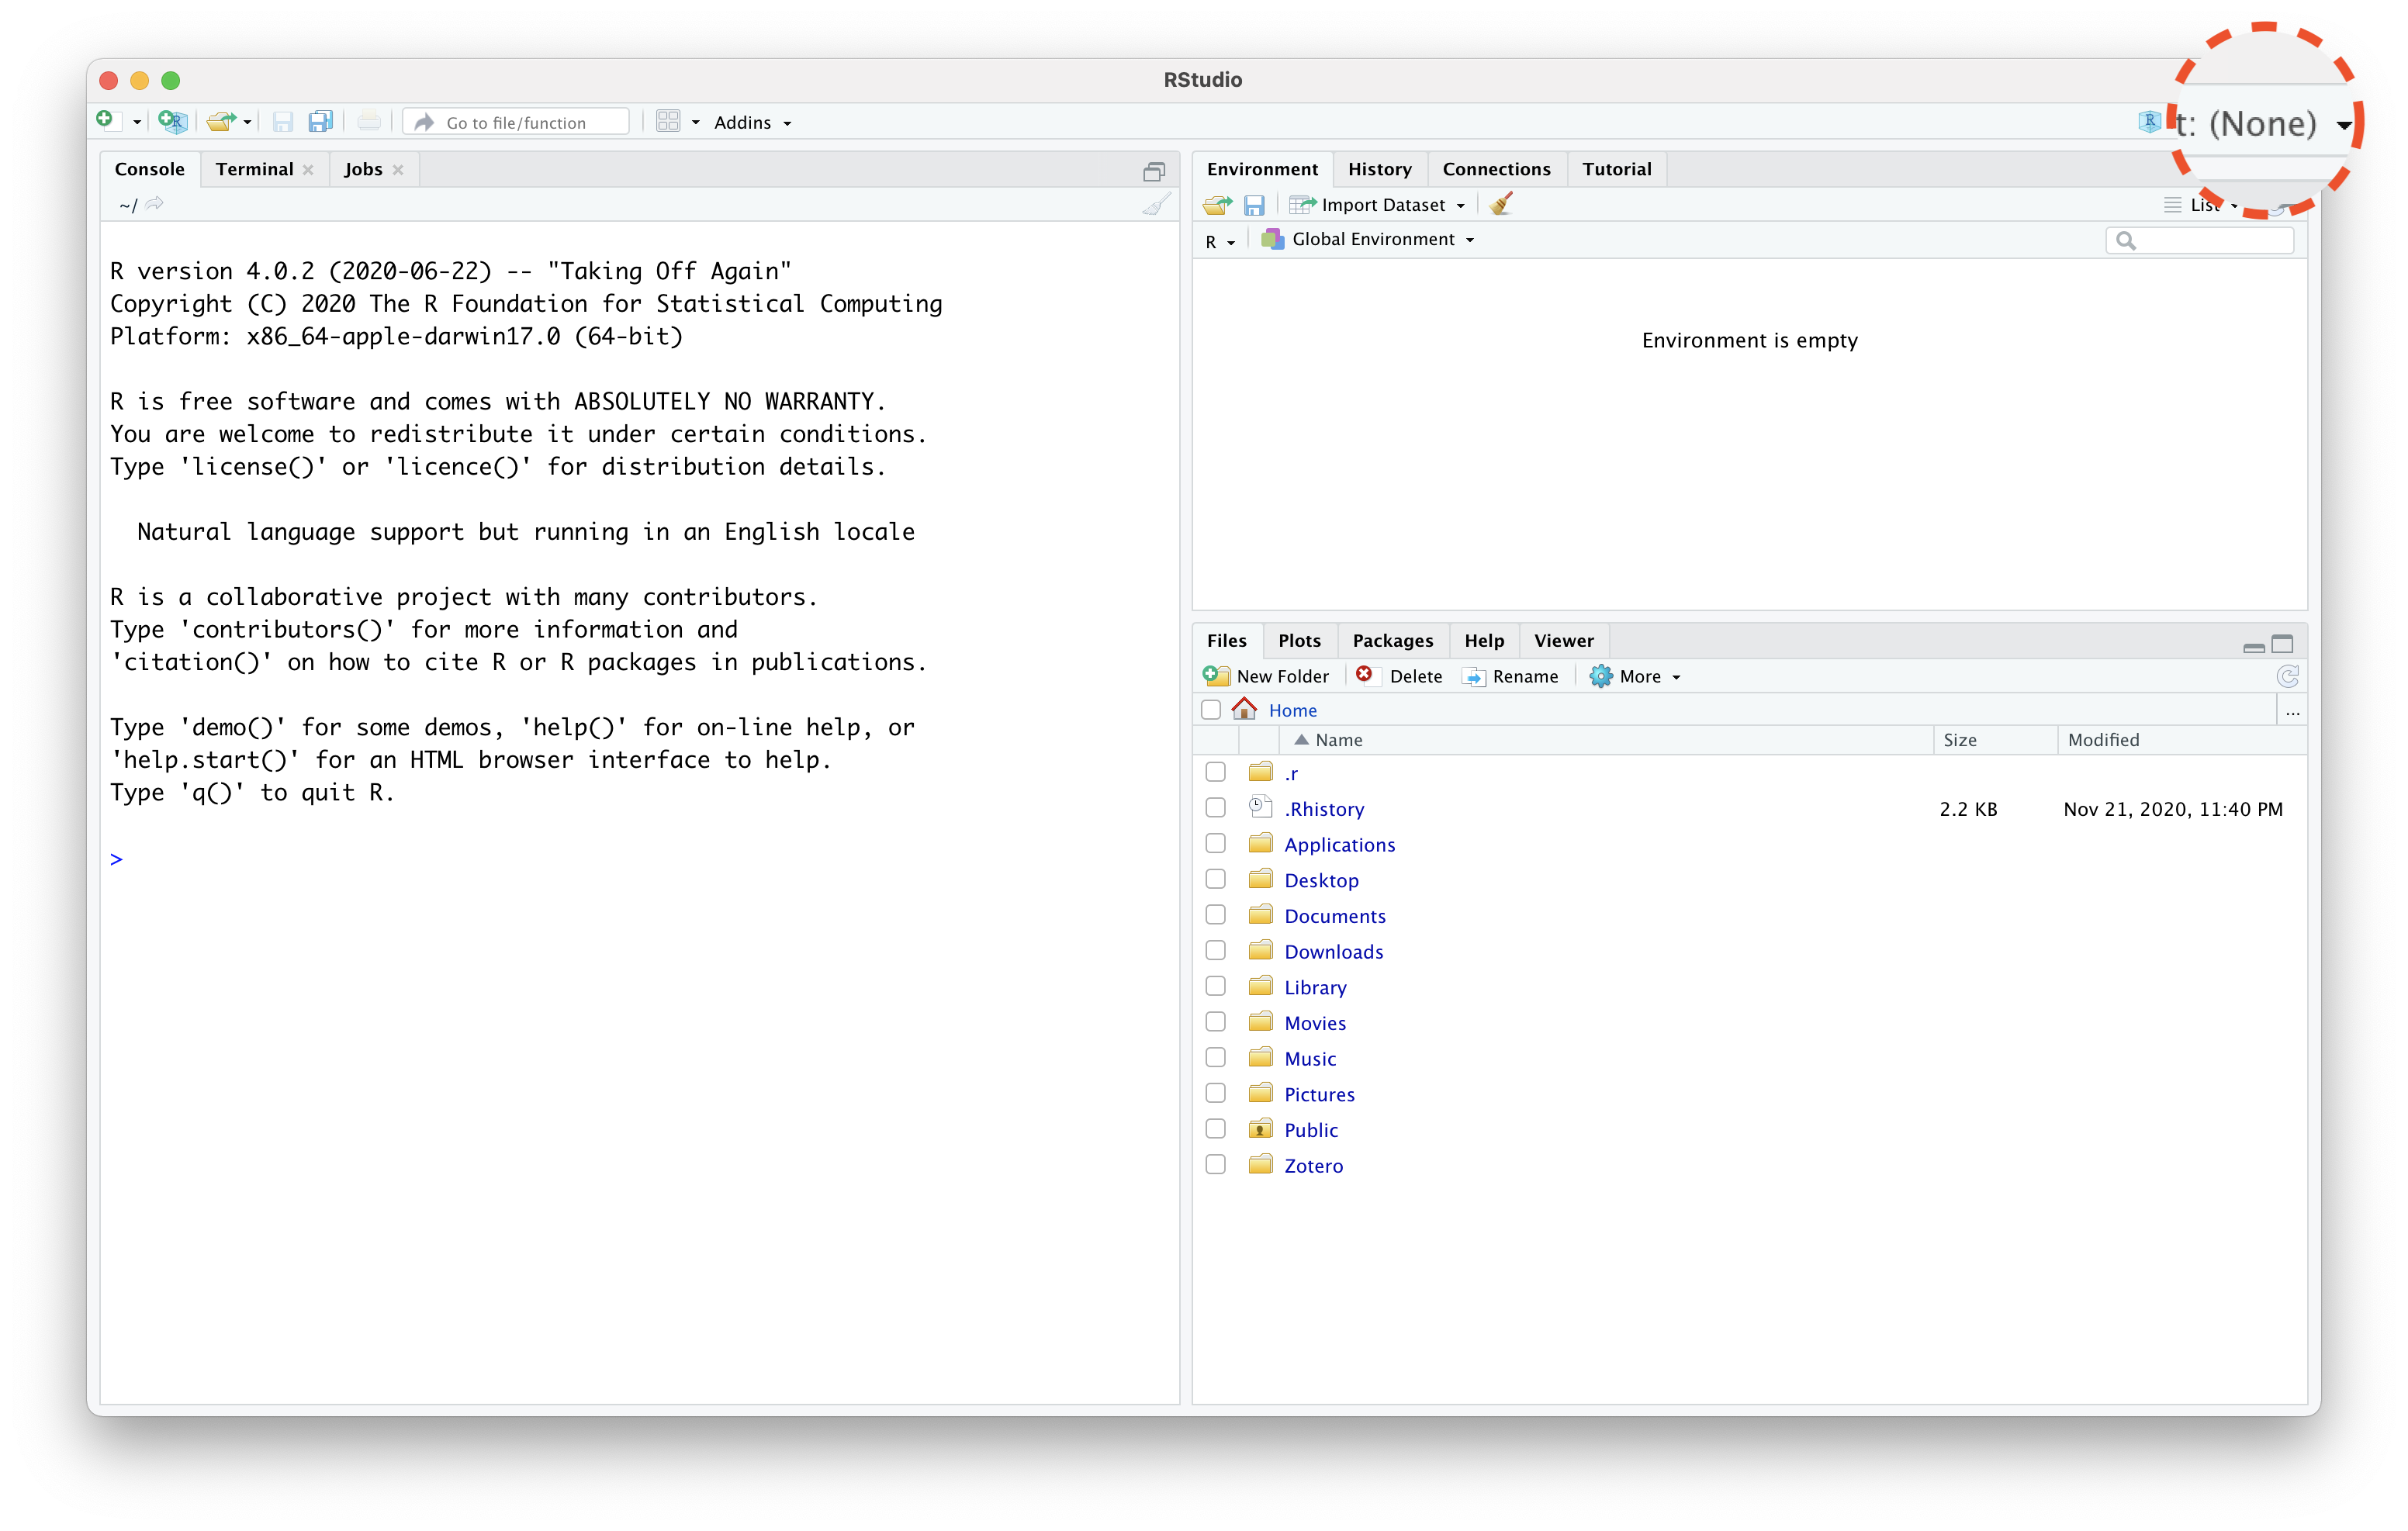
RStudio Without Project
RStudio Without Project
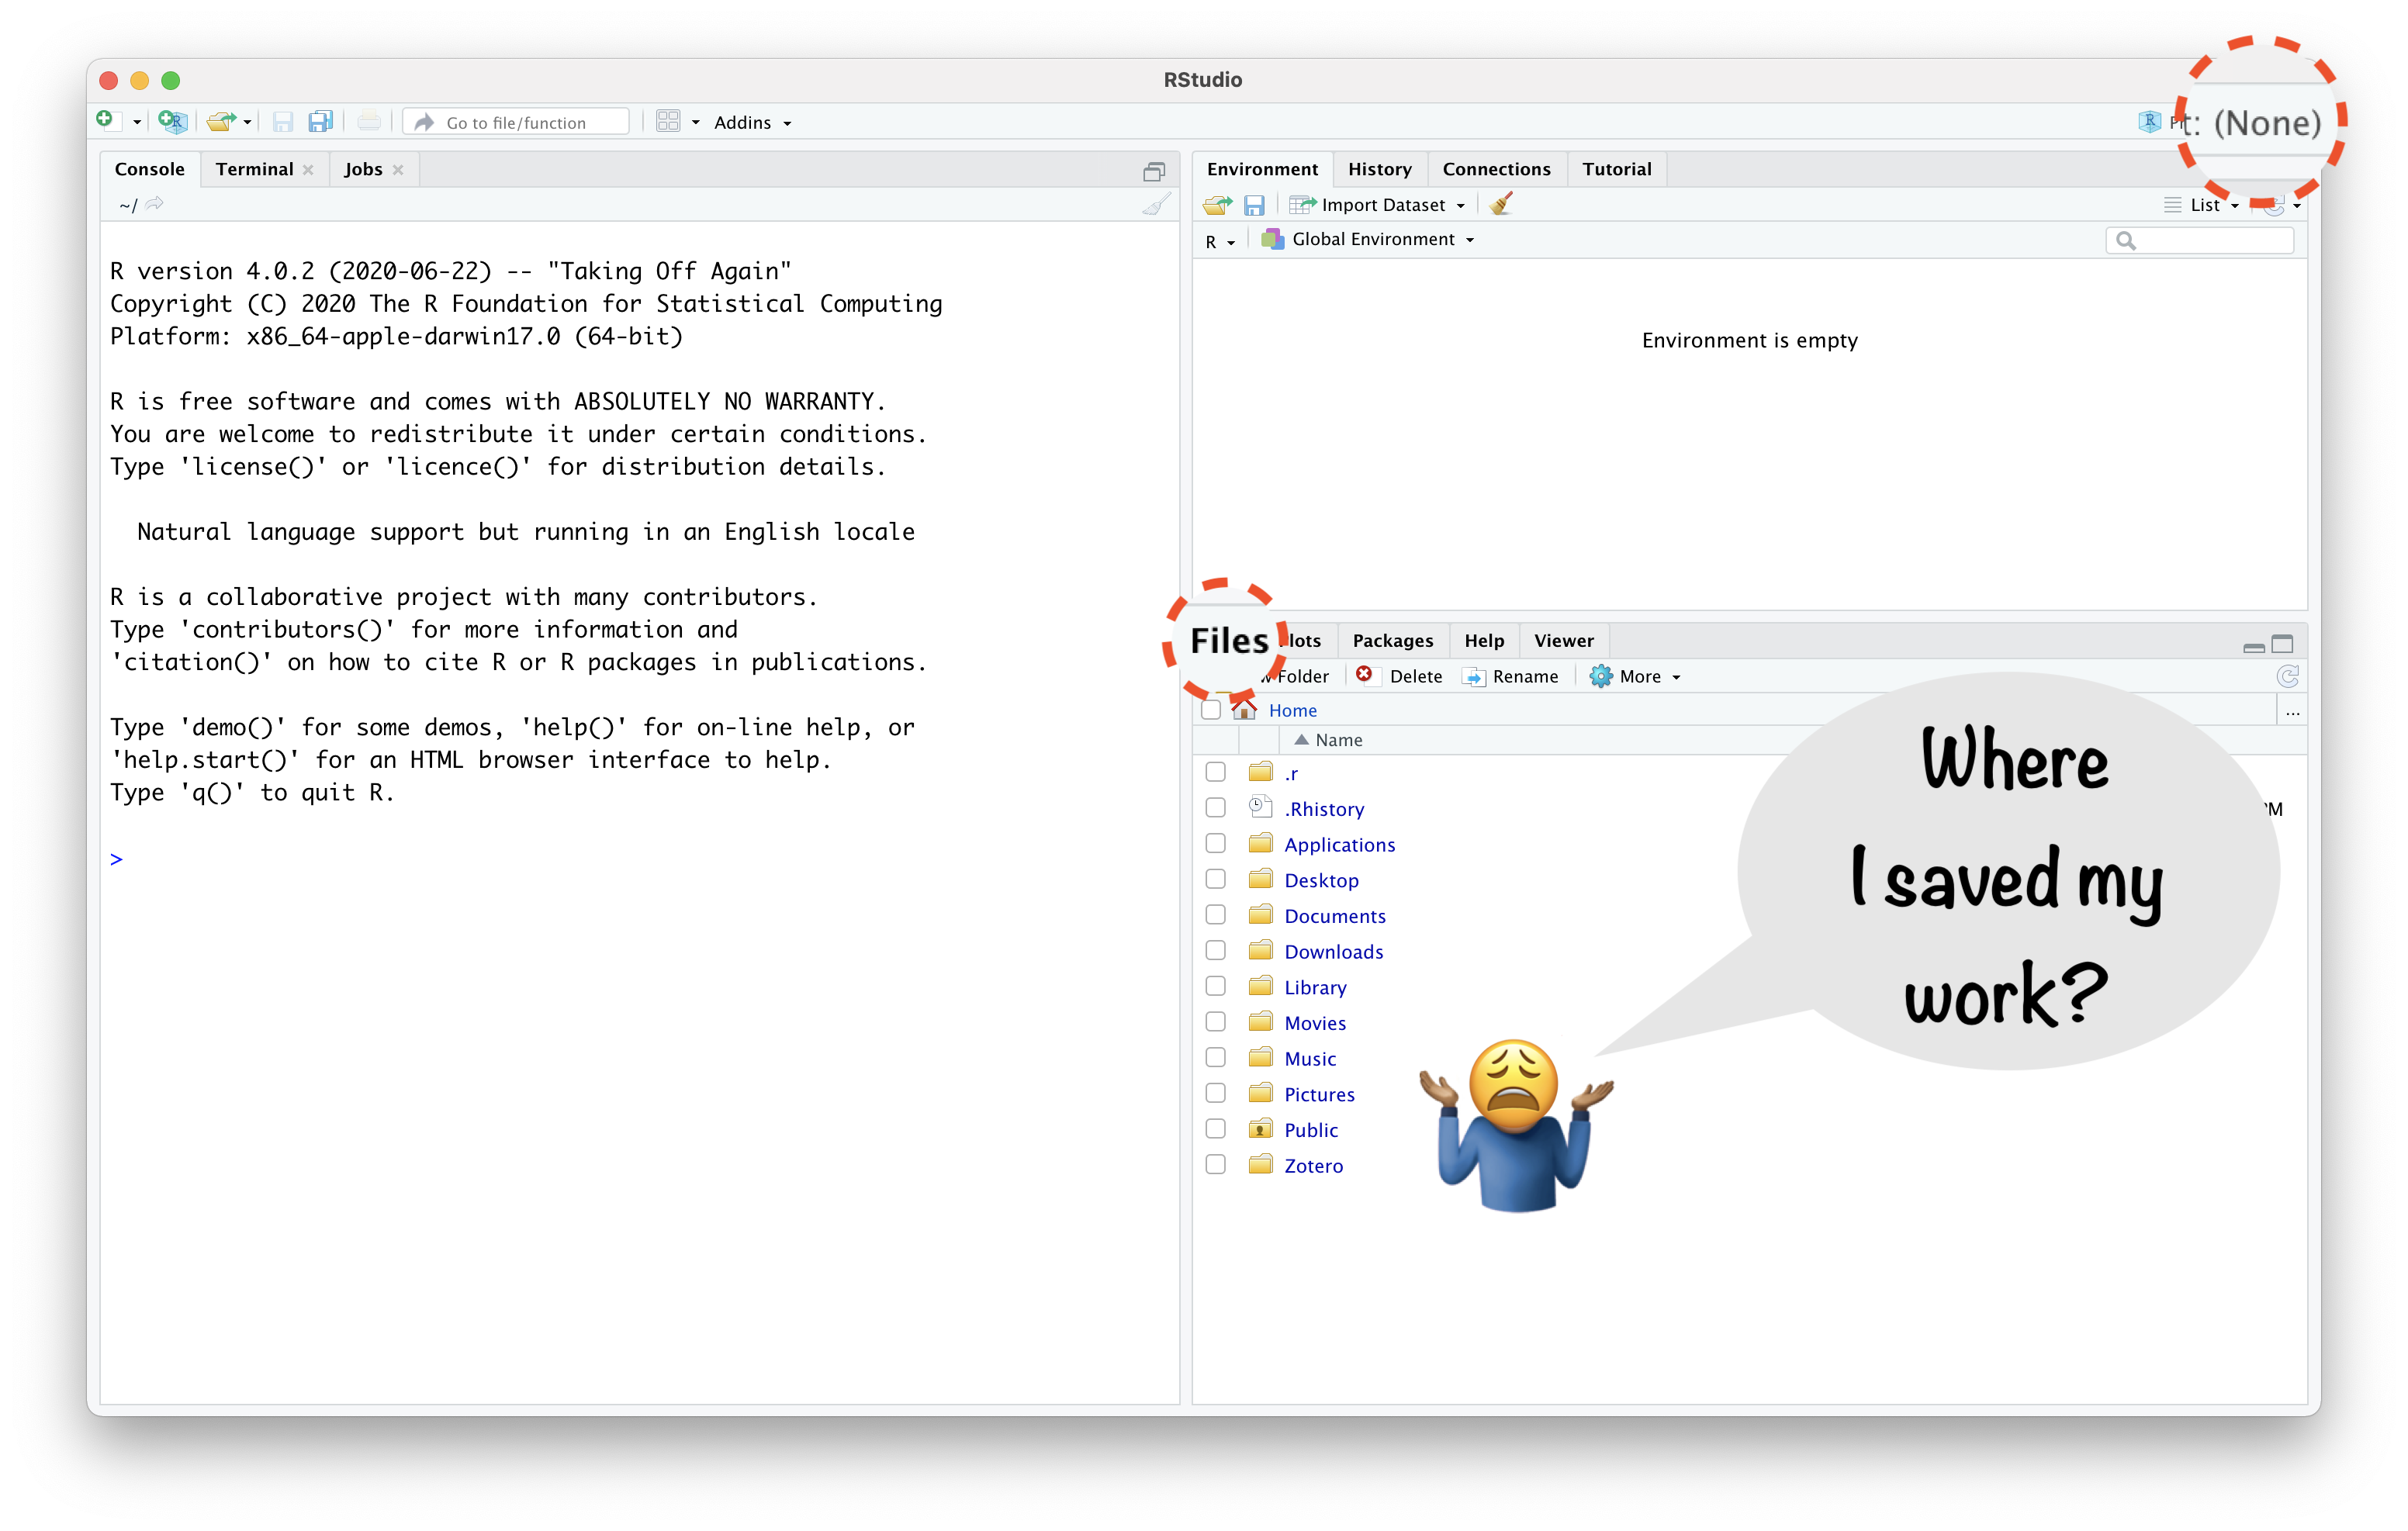
RStudio Project Helps:
“to divide your work into multiple contexts, each with their own”
- Working directory,
- Workspace,
- History, and
- Source documents.
Source: RStudio & artwork by Allison Horst
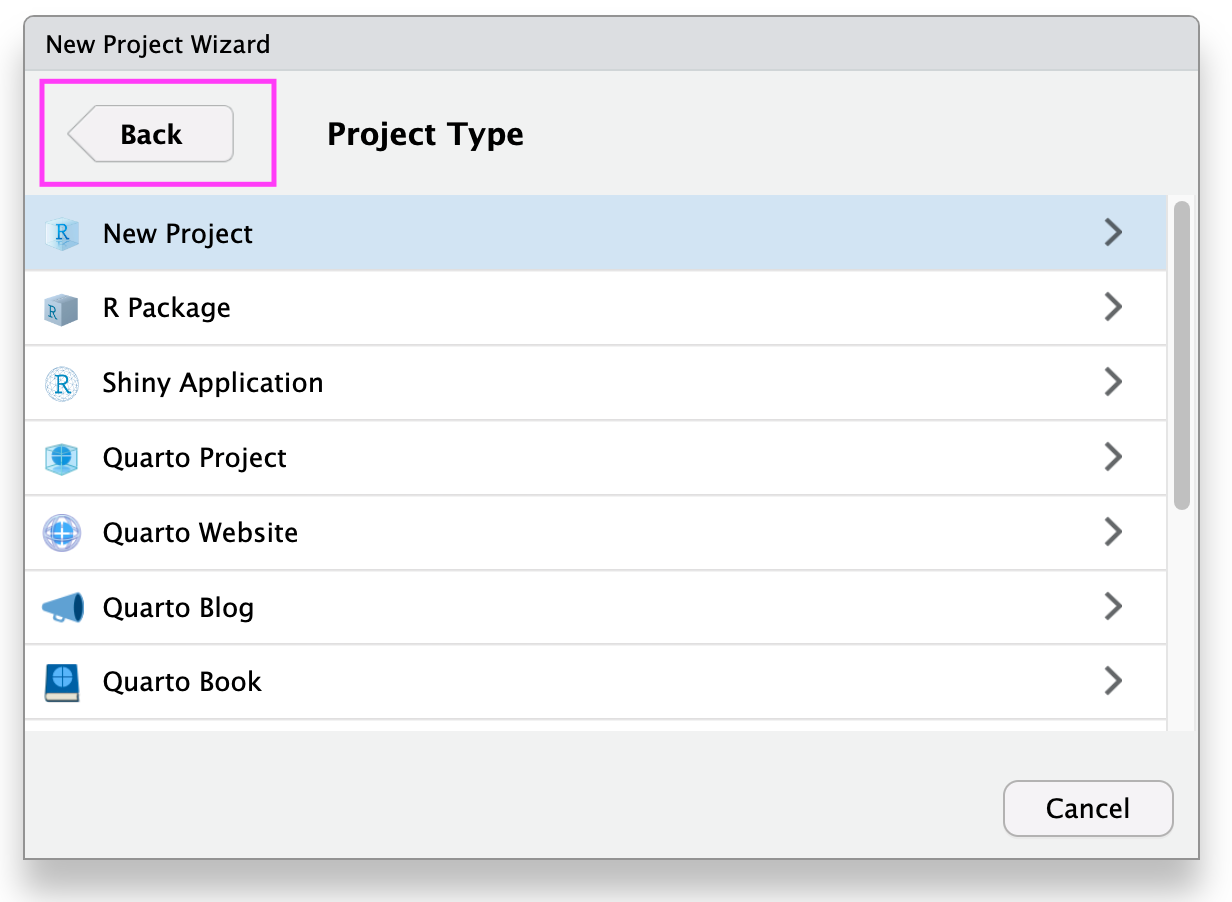
Create RStudio project
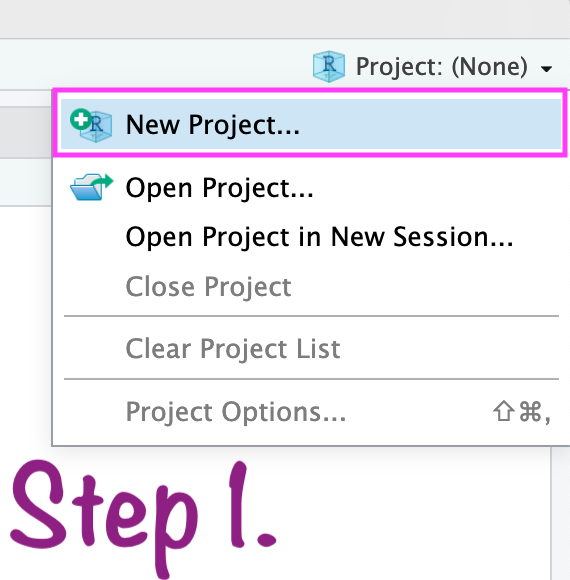
Create RStudio project
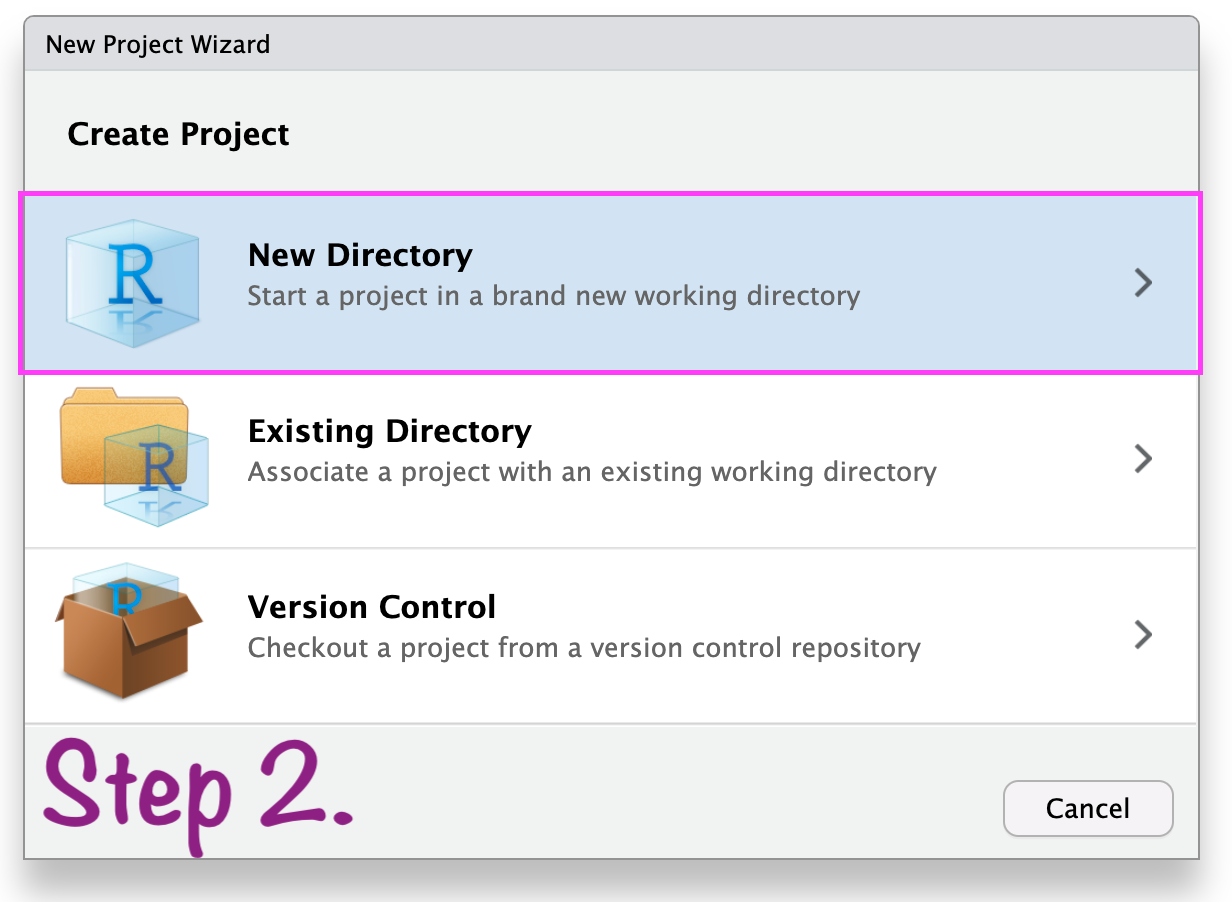
In case anything goes wrong\(...\)
Create RStudio Project
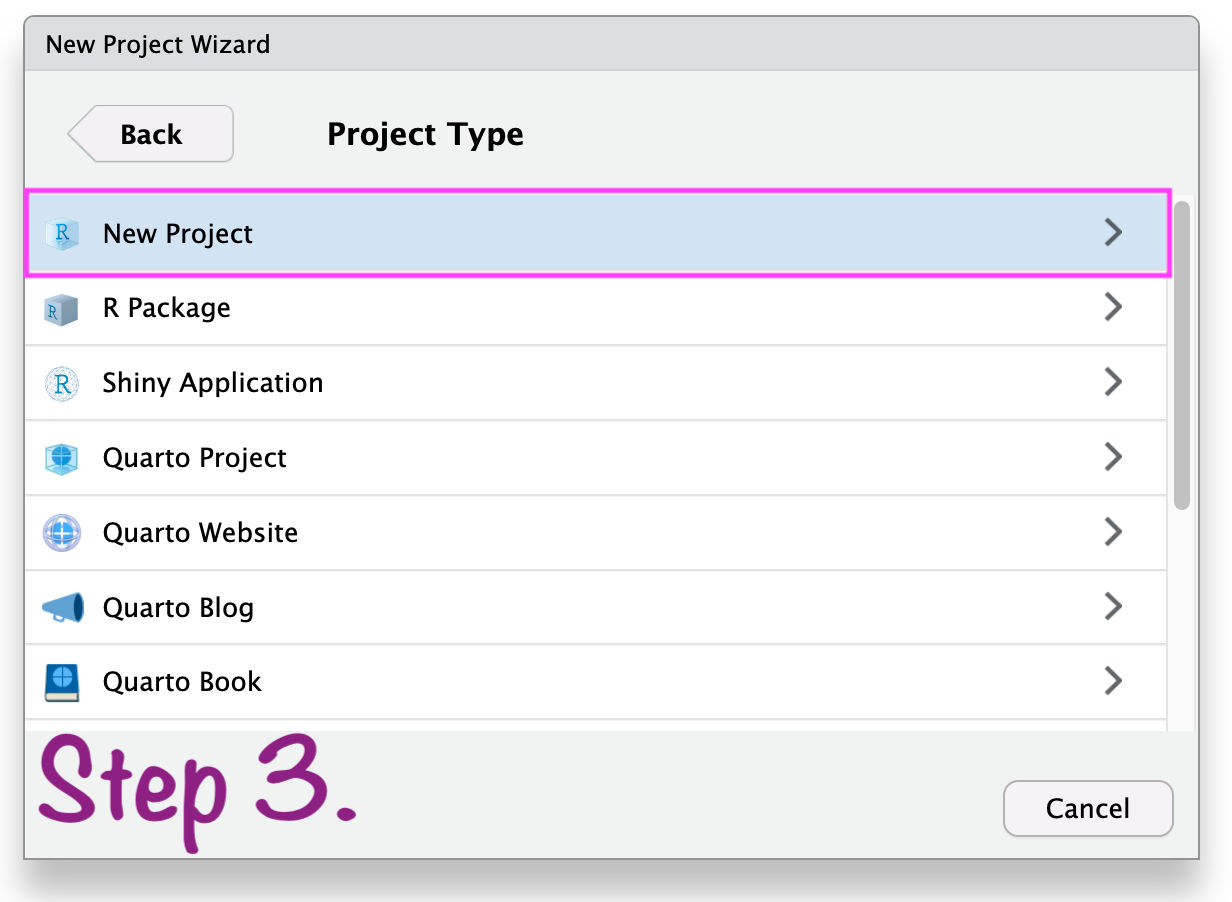
Create RStudio project
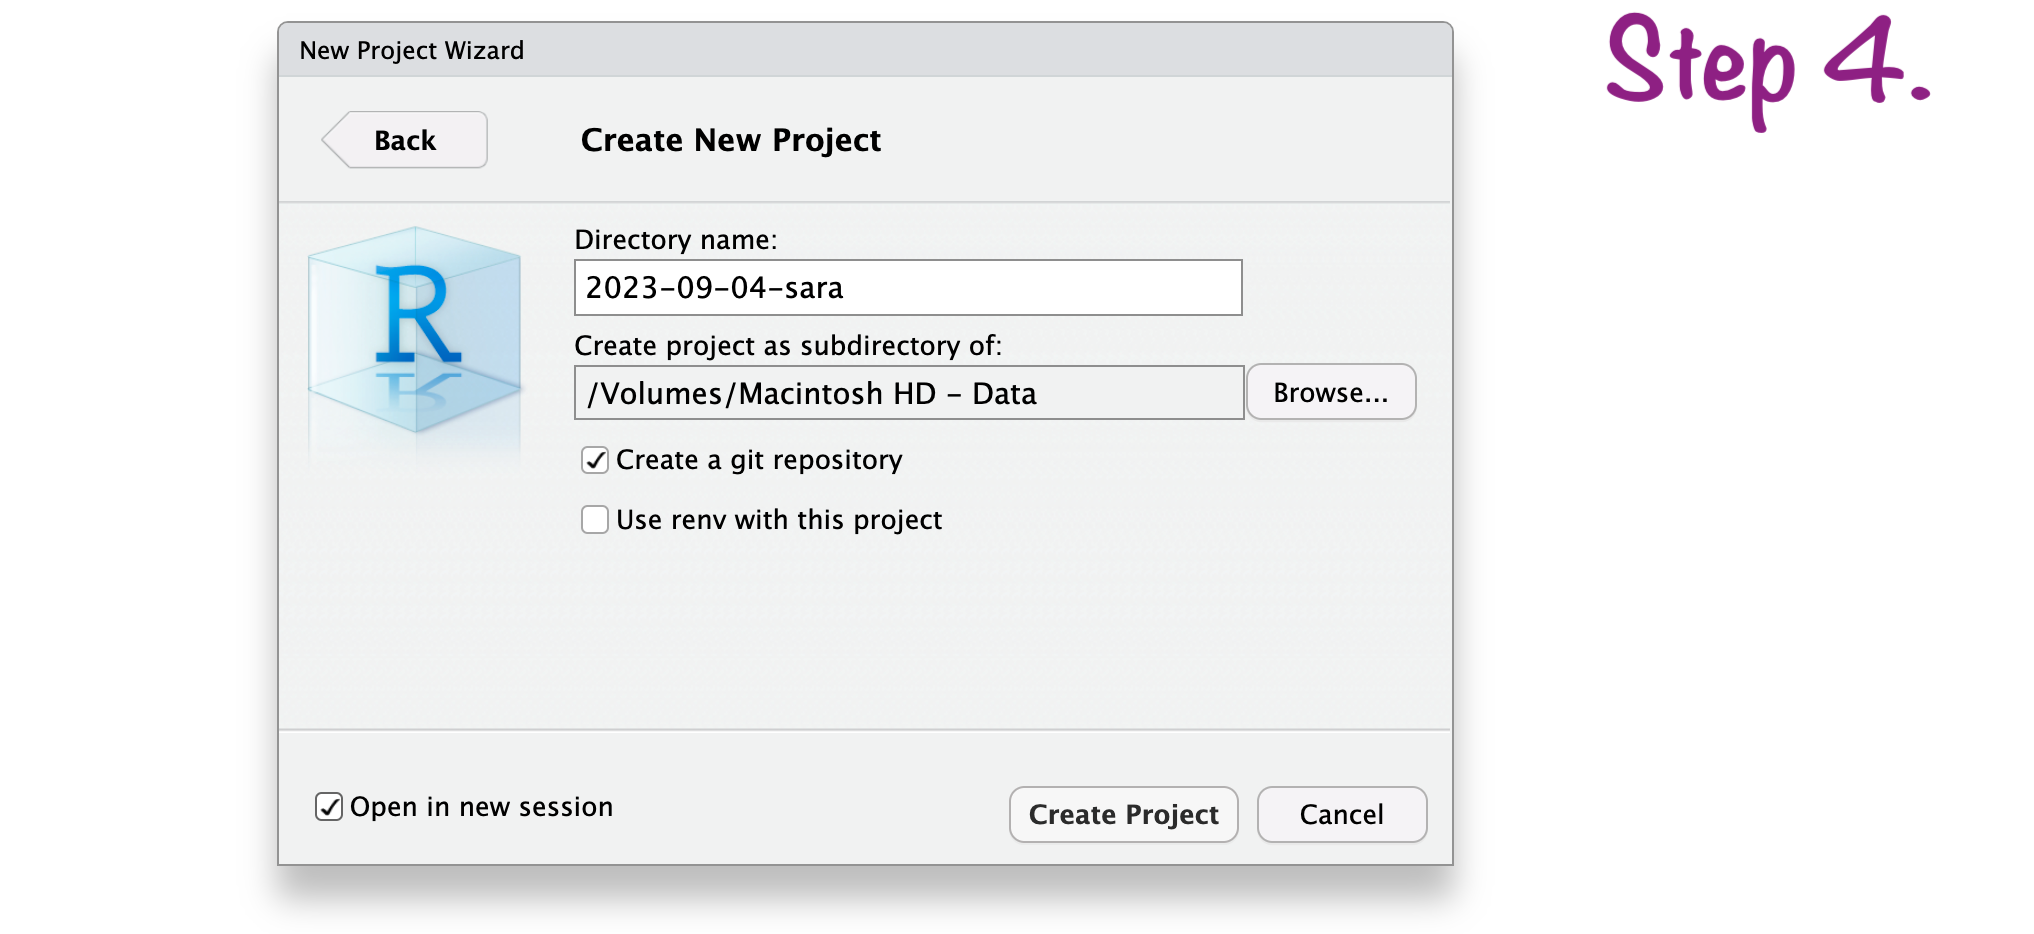
Create RStudio project
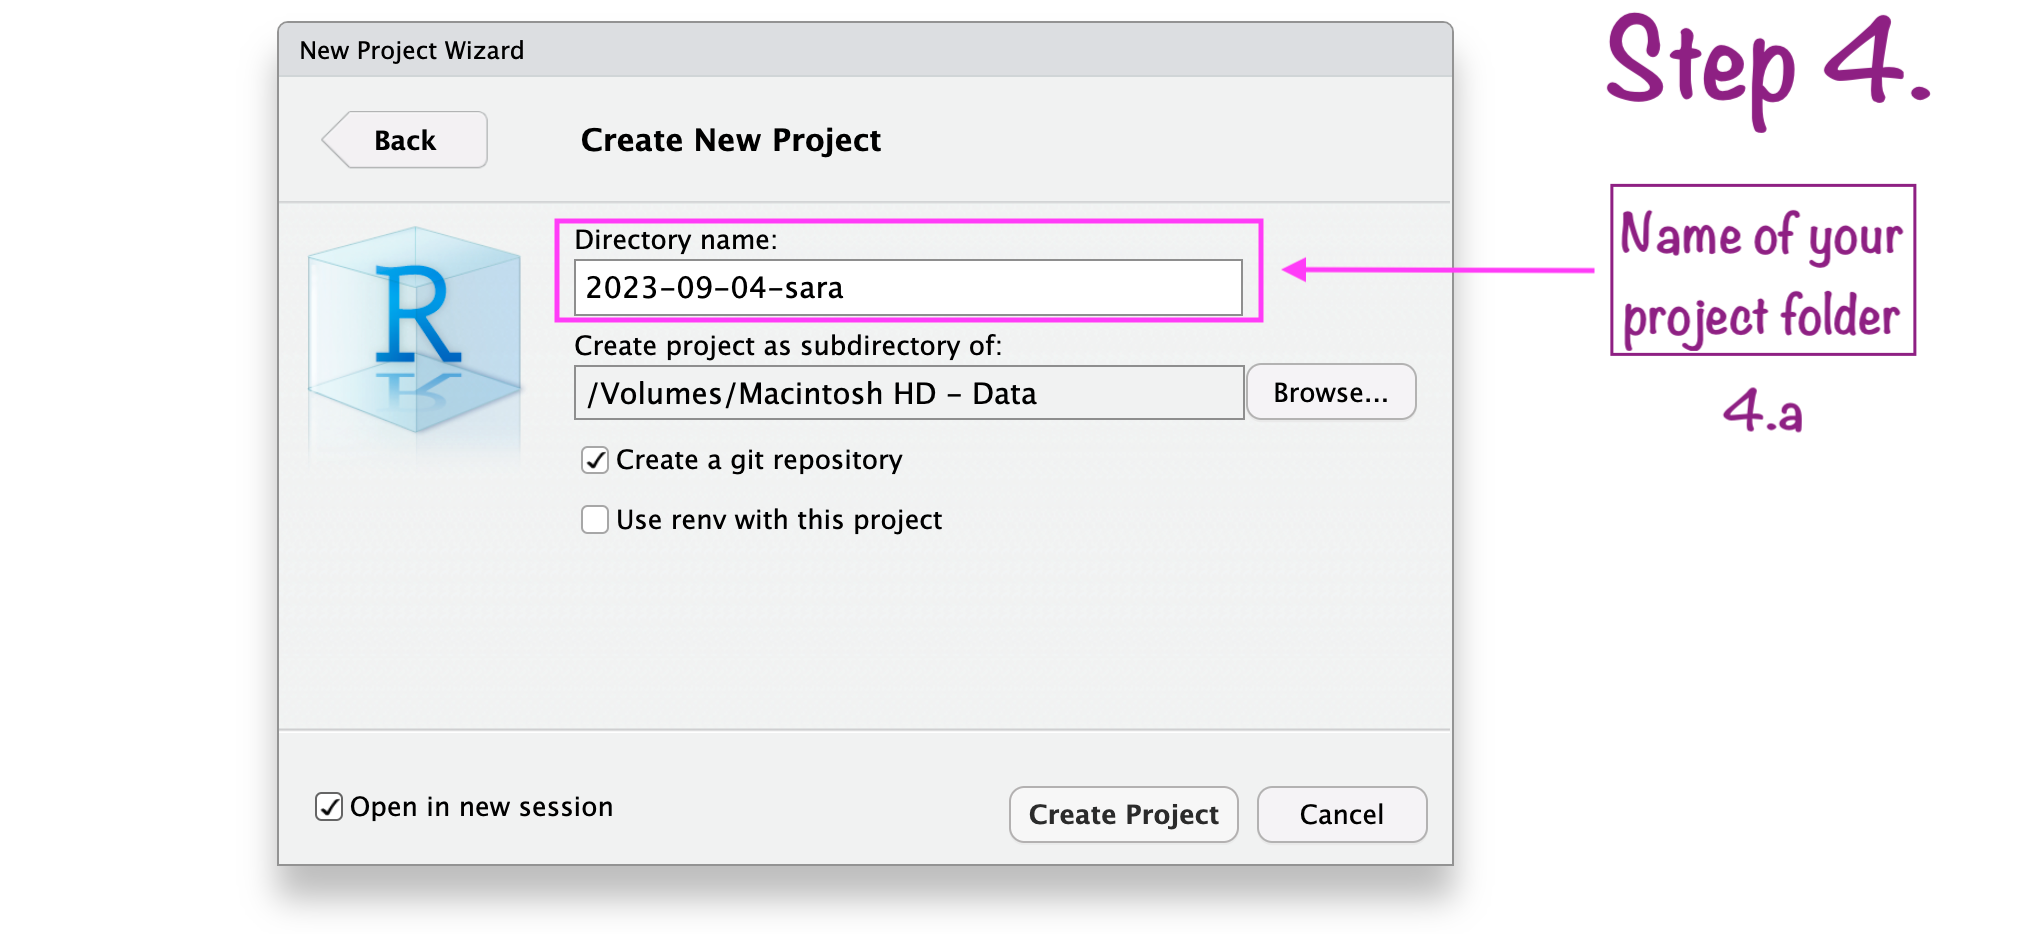
Create RStudio project
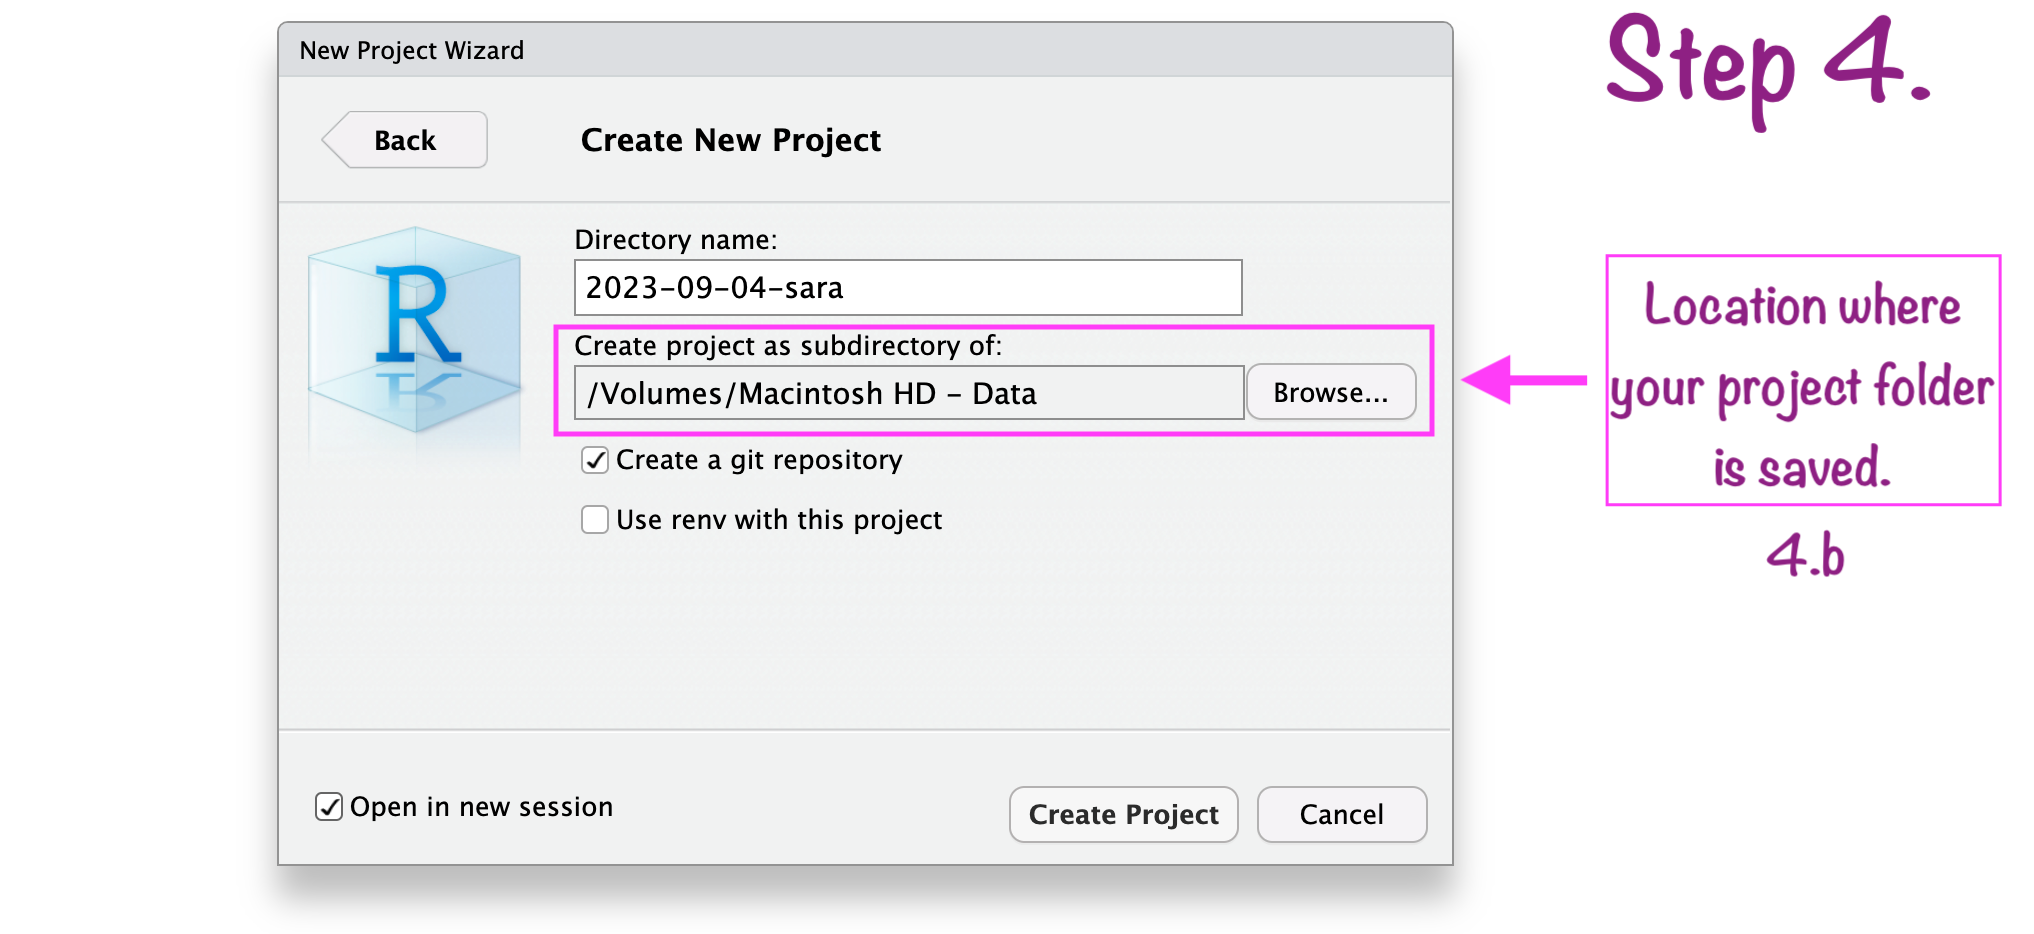
Create RStudio project
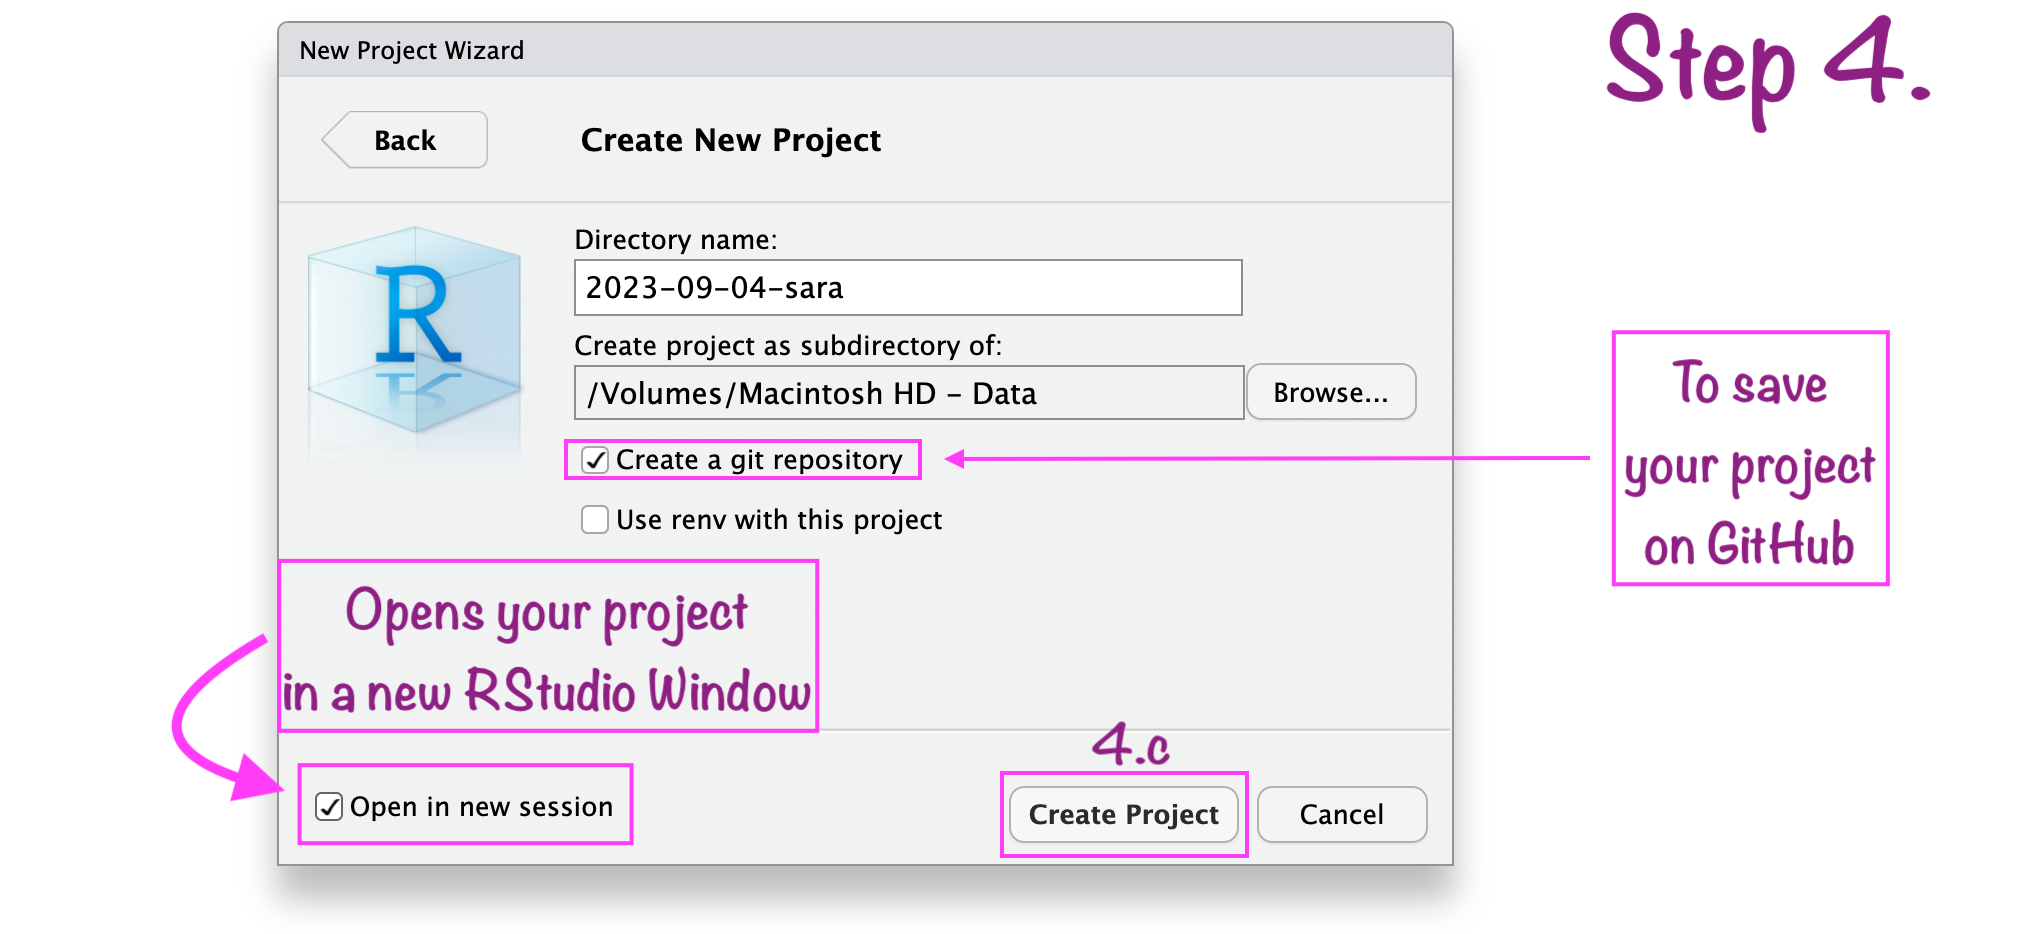
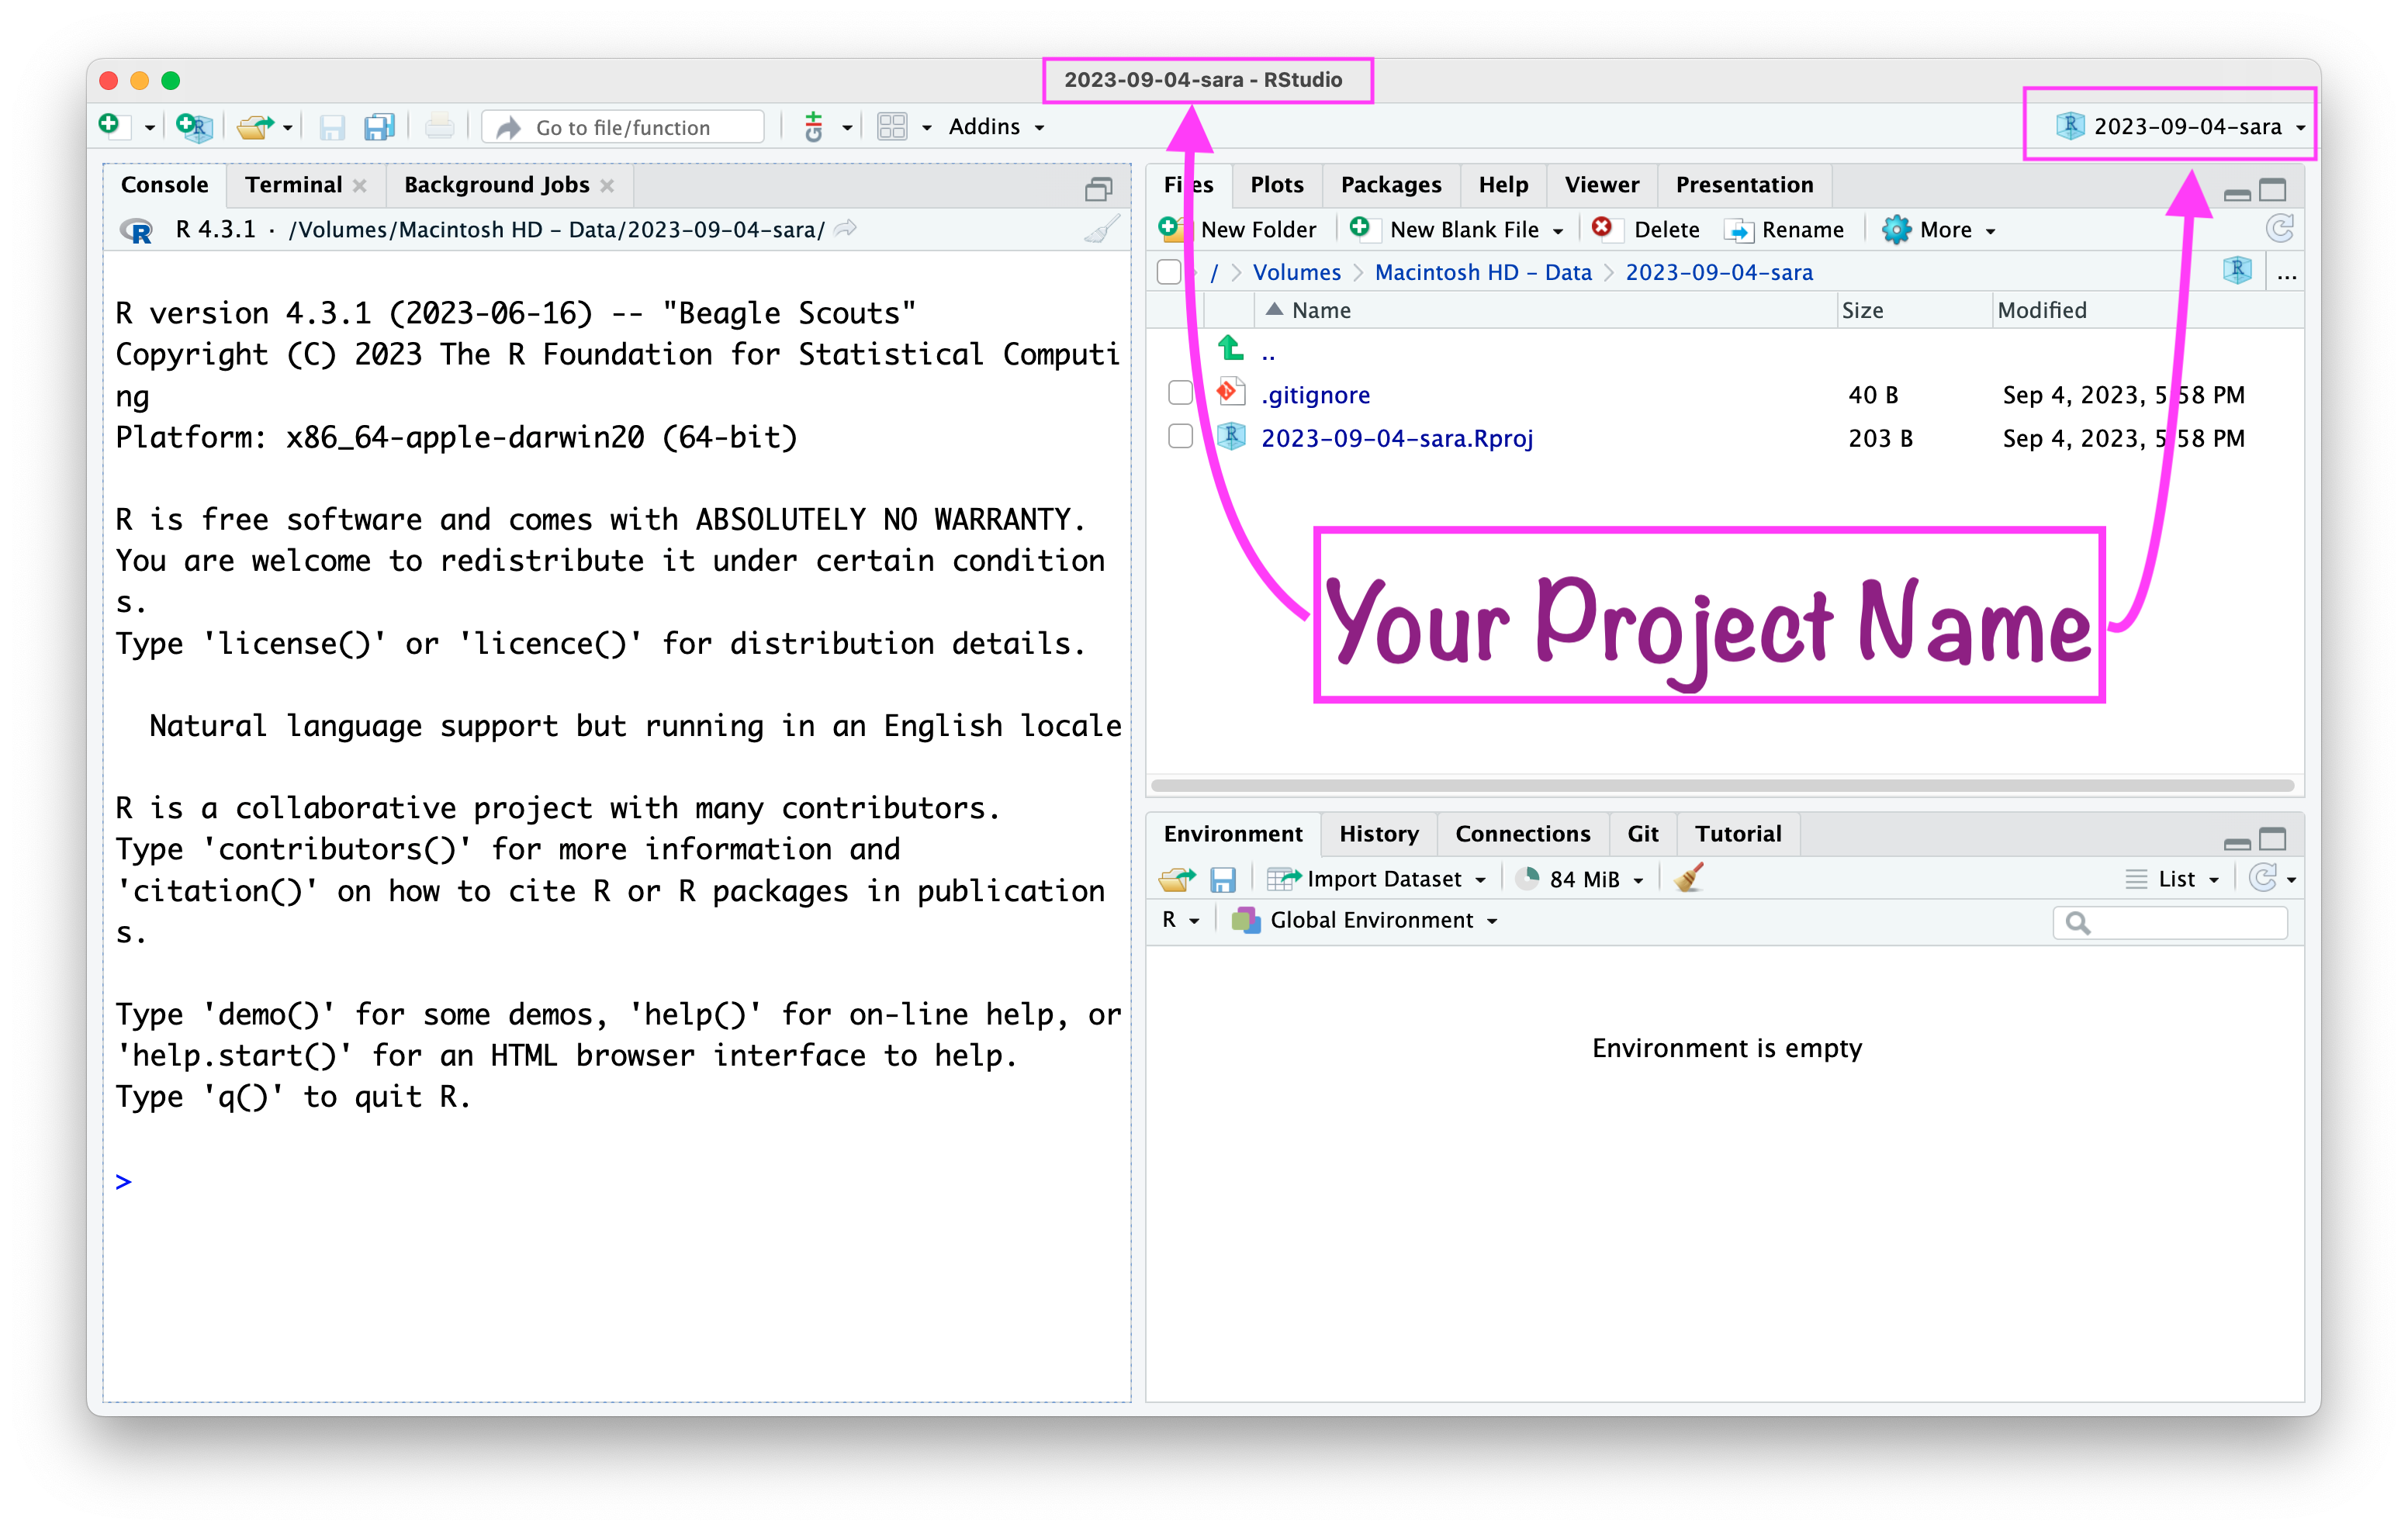
RStudio project “name”
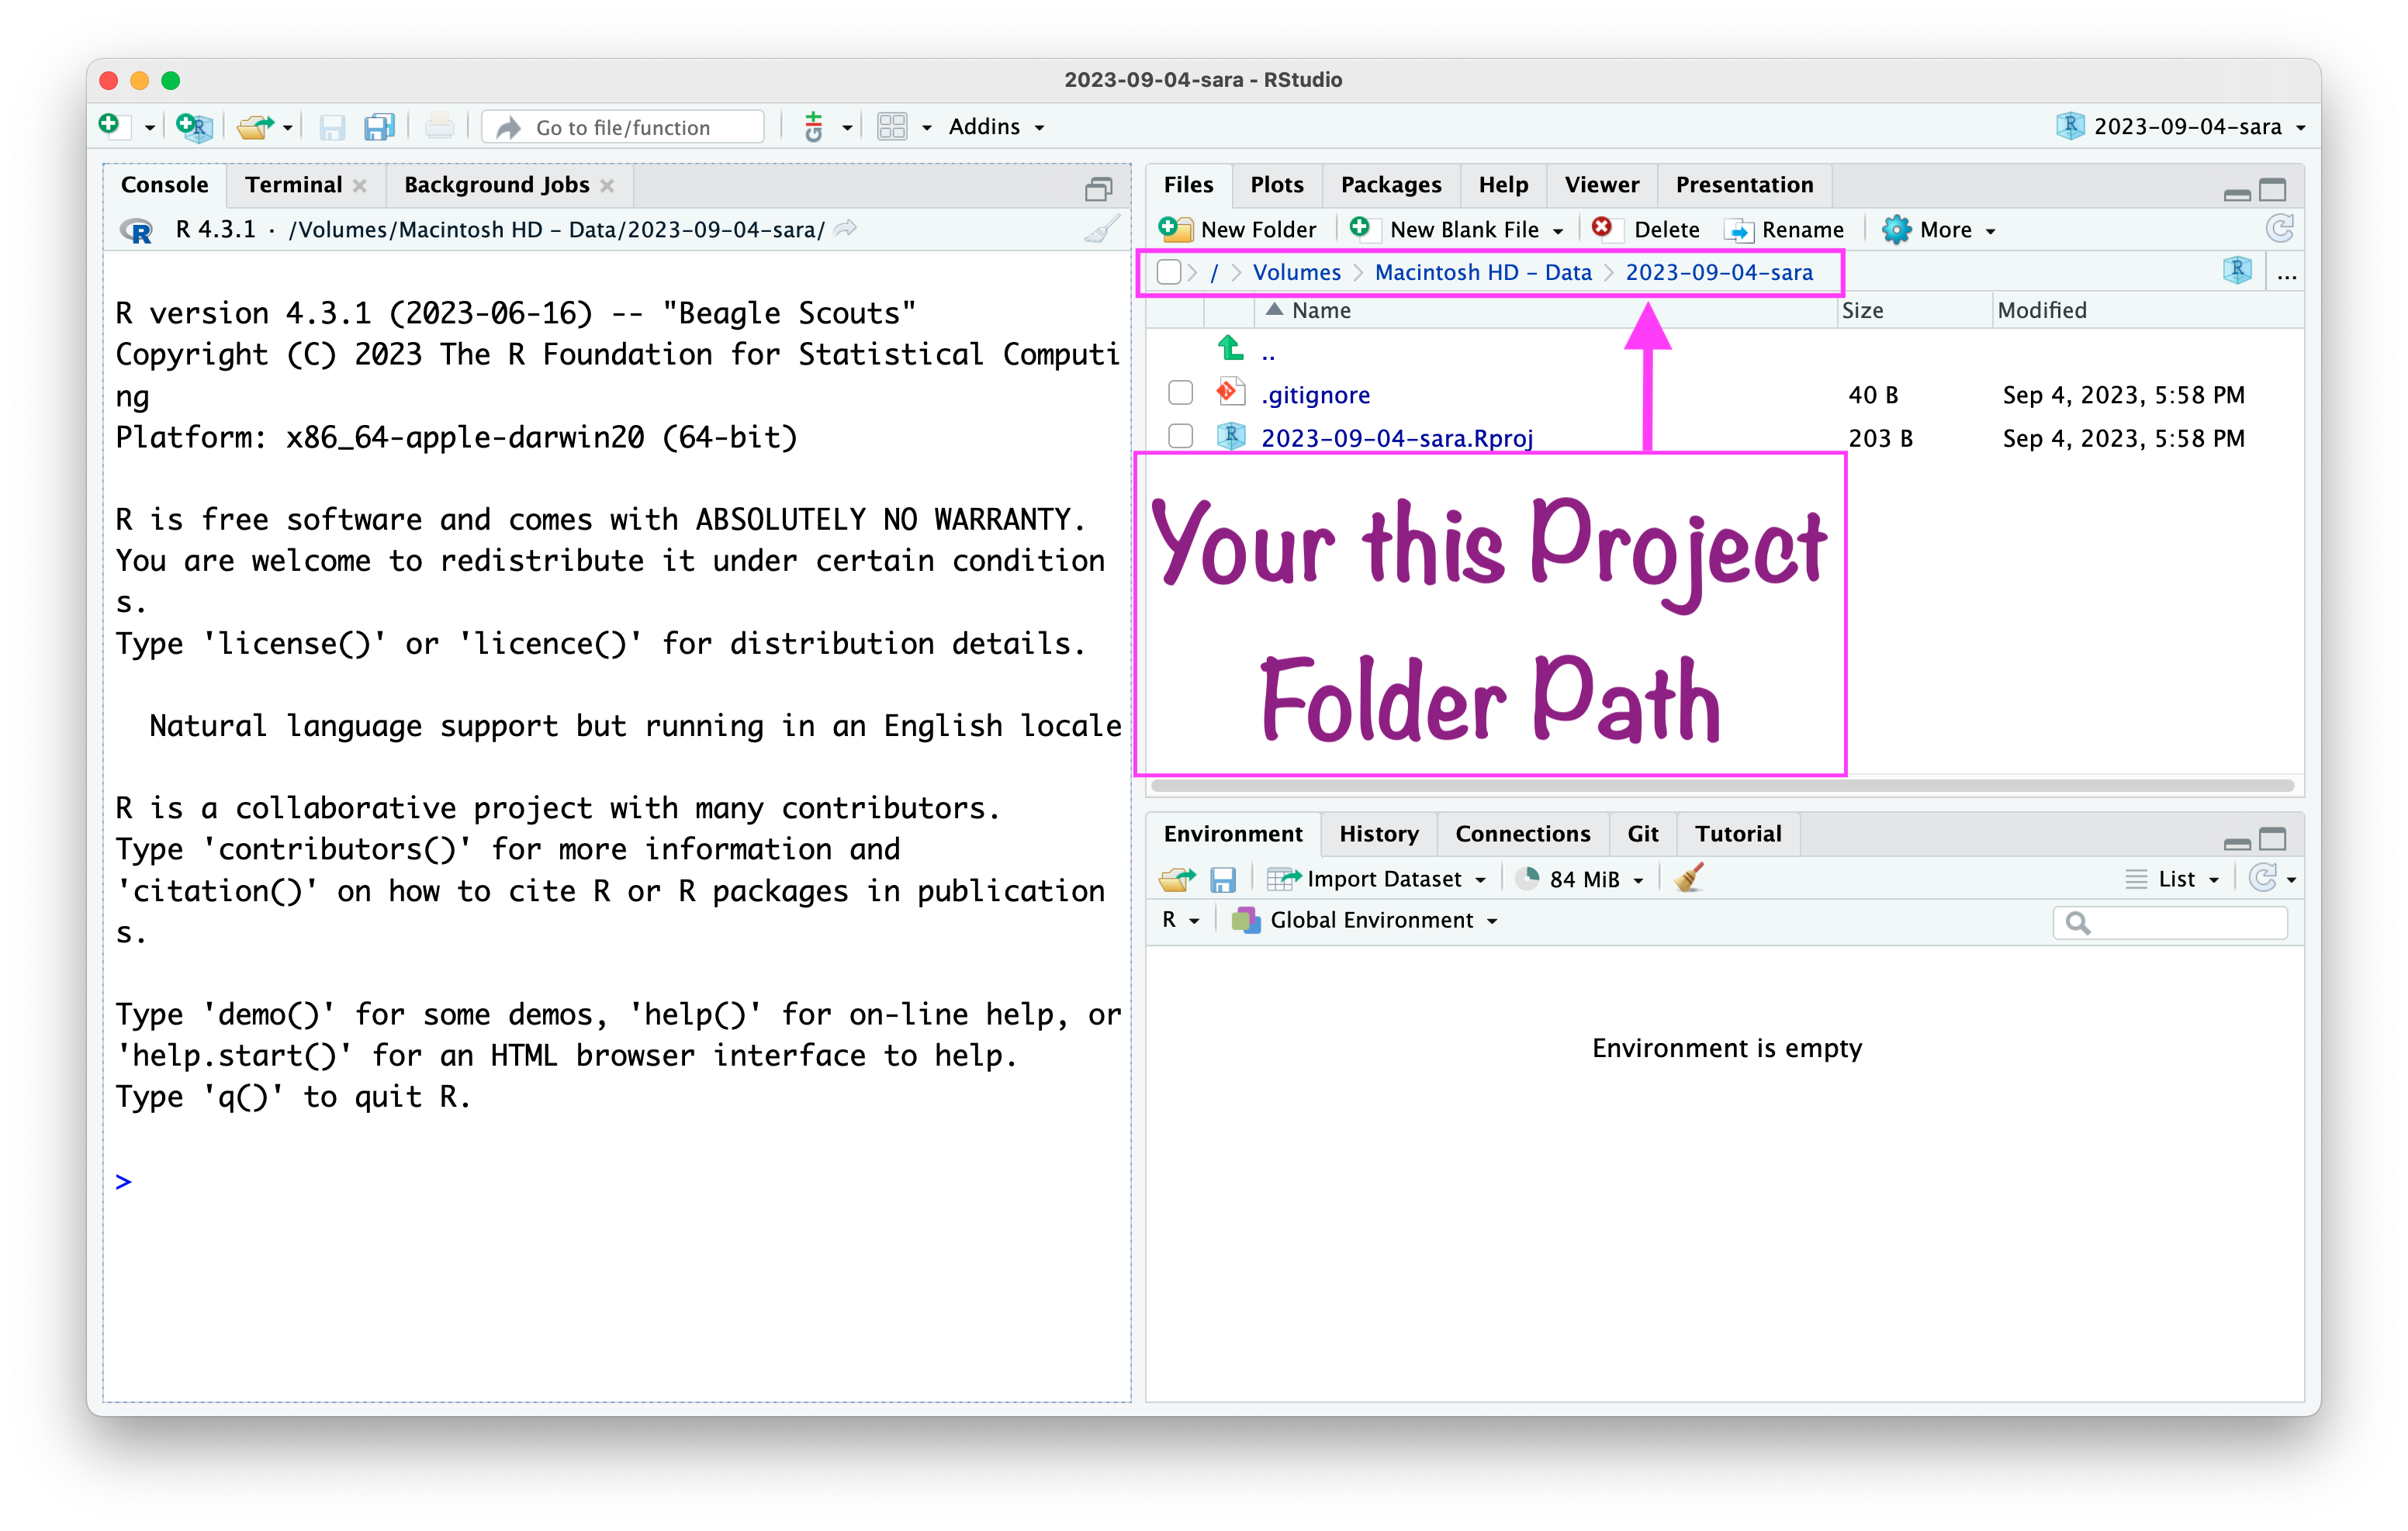
RStudio project “path”
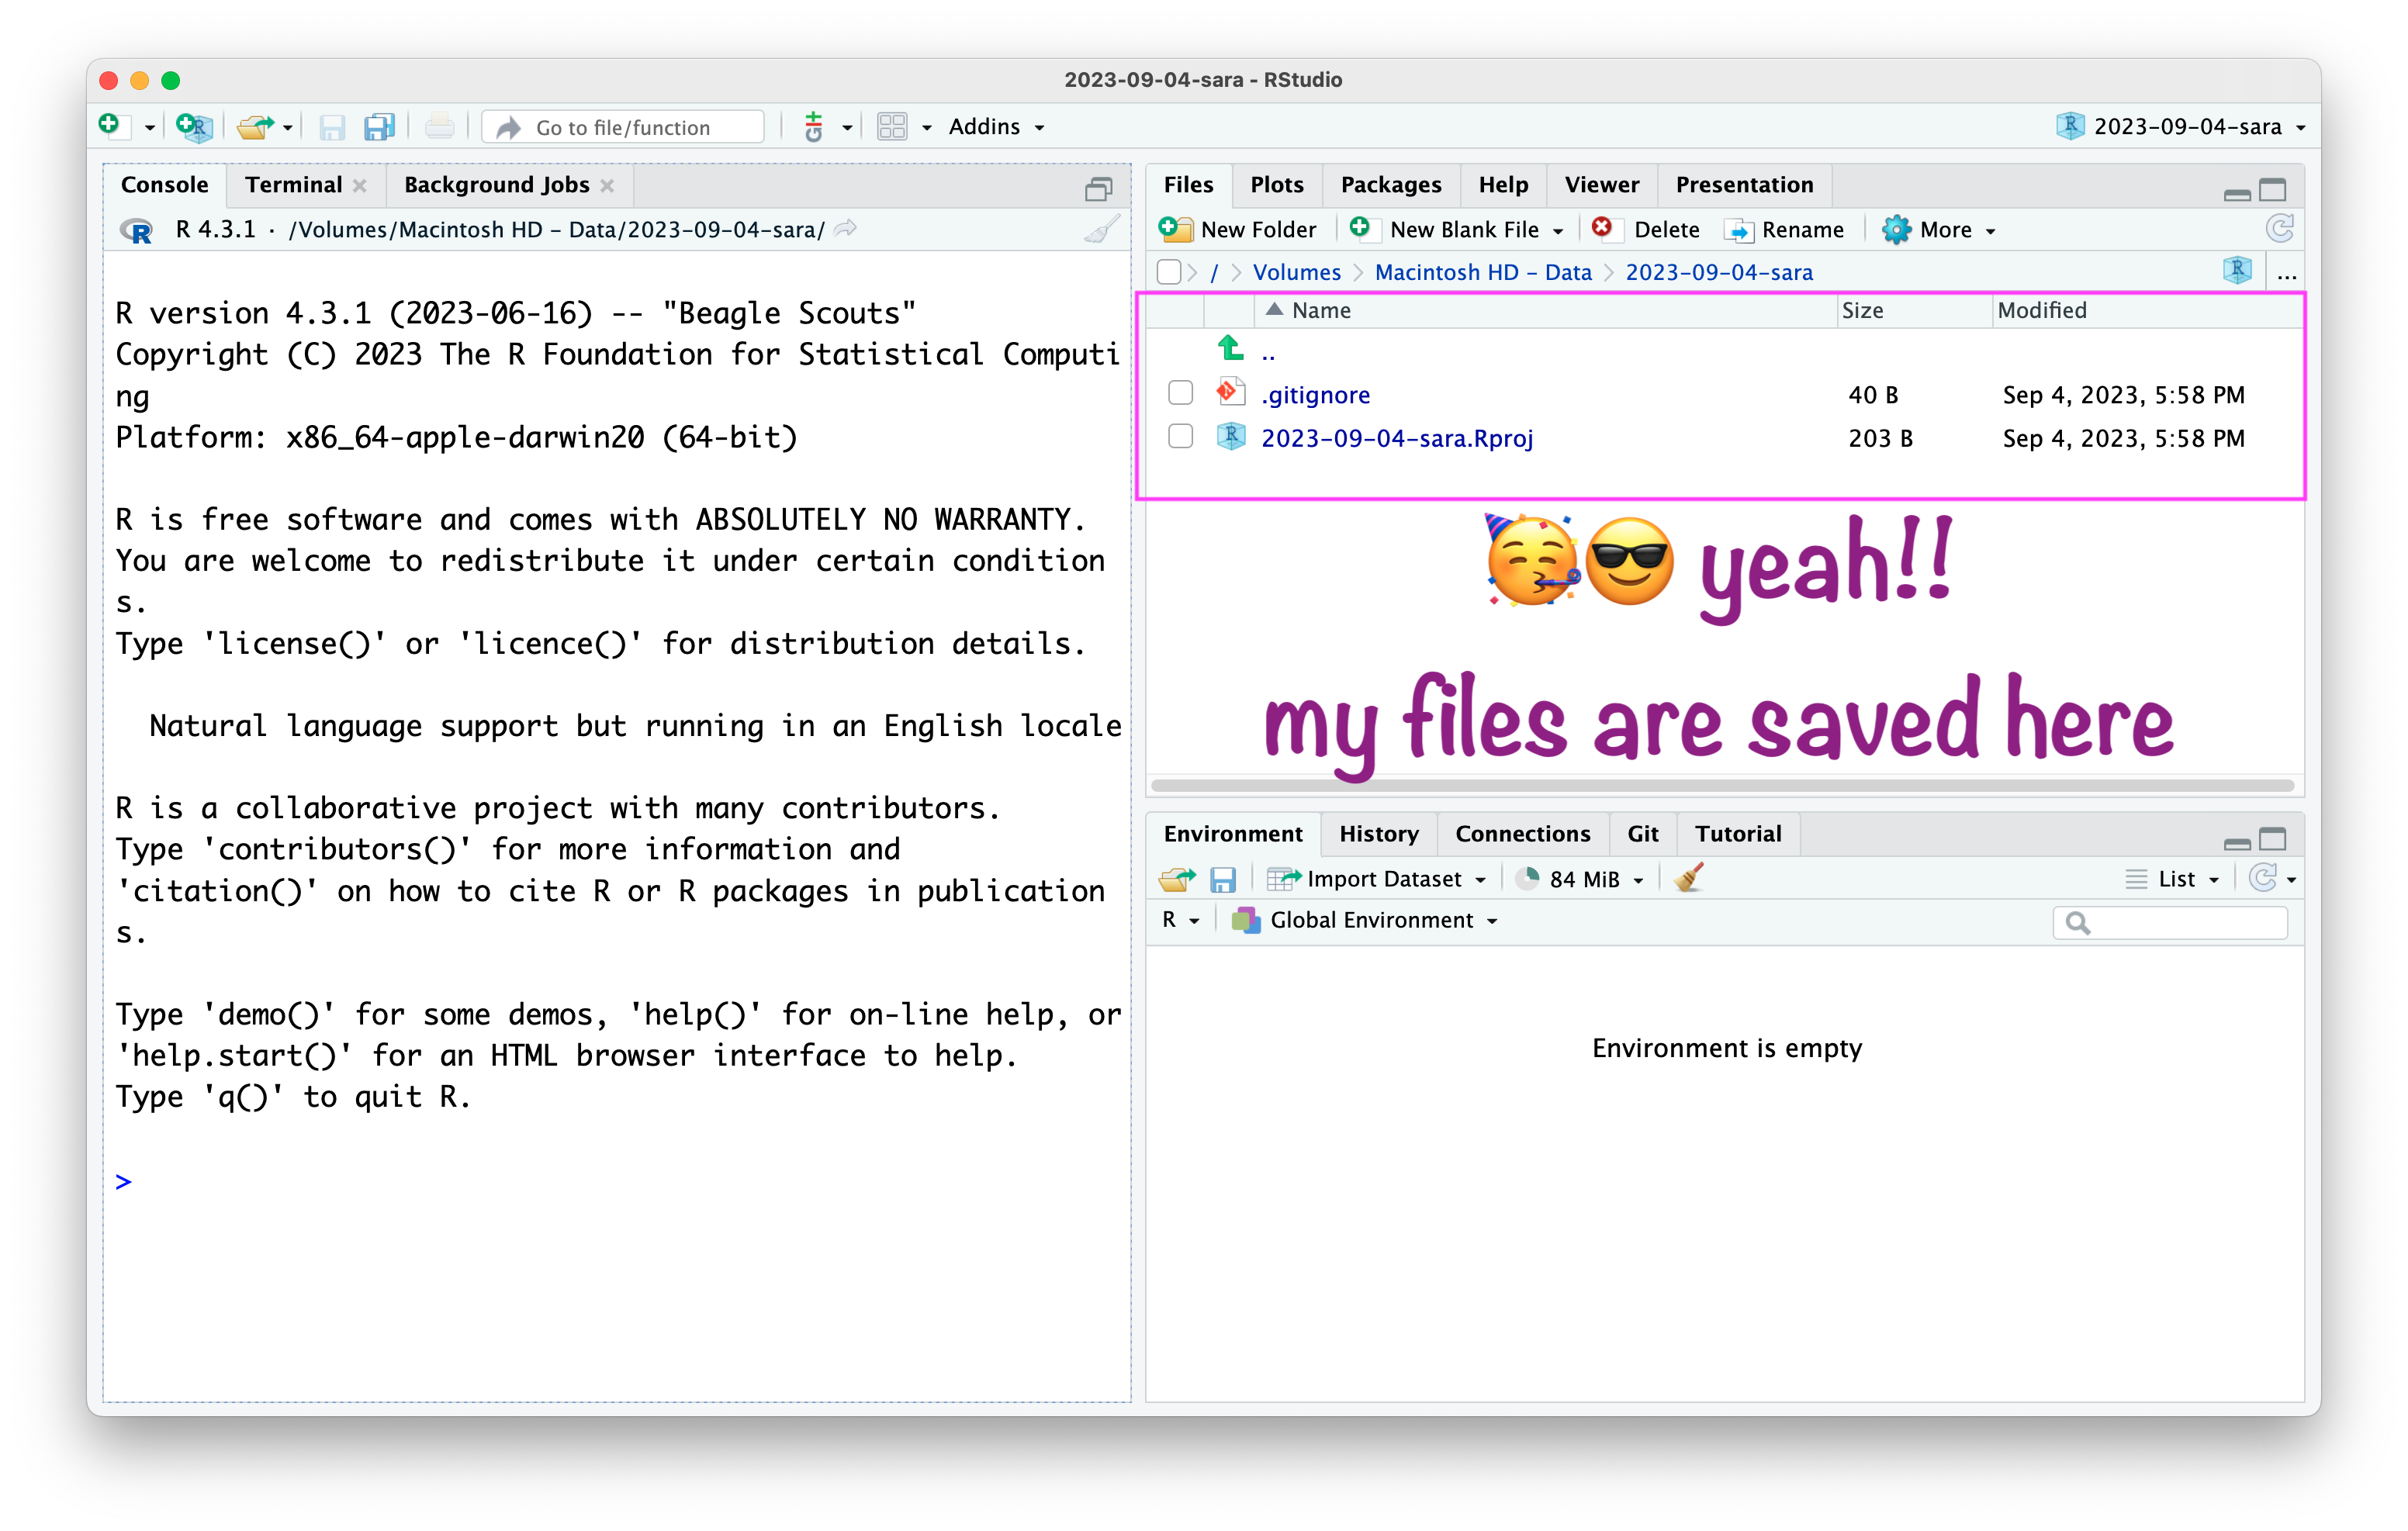
RStudio project
Your Turn
Run these codes in the console of RStudio
- “Hello World”
- 12 + 2
- 3 * 9
- 34 == 34
- 67 == 90
R Script
Pros of R Script (.R File)
Clean and focused - a
.Rfile contains only code, making it easy to read, edit, and run without any extra formatting.Fast to execute - you can run the entire script in one go, making it ideal data cleaning scripts, and automation.
Easy to share and version control - a plain
.Rfile is lightweight and it opens immediately.
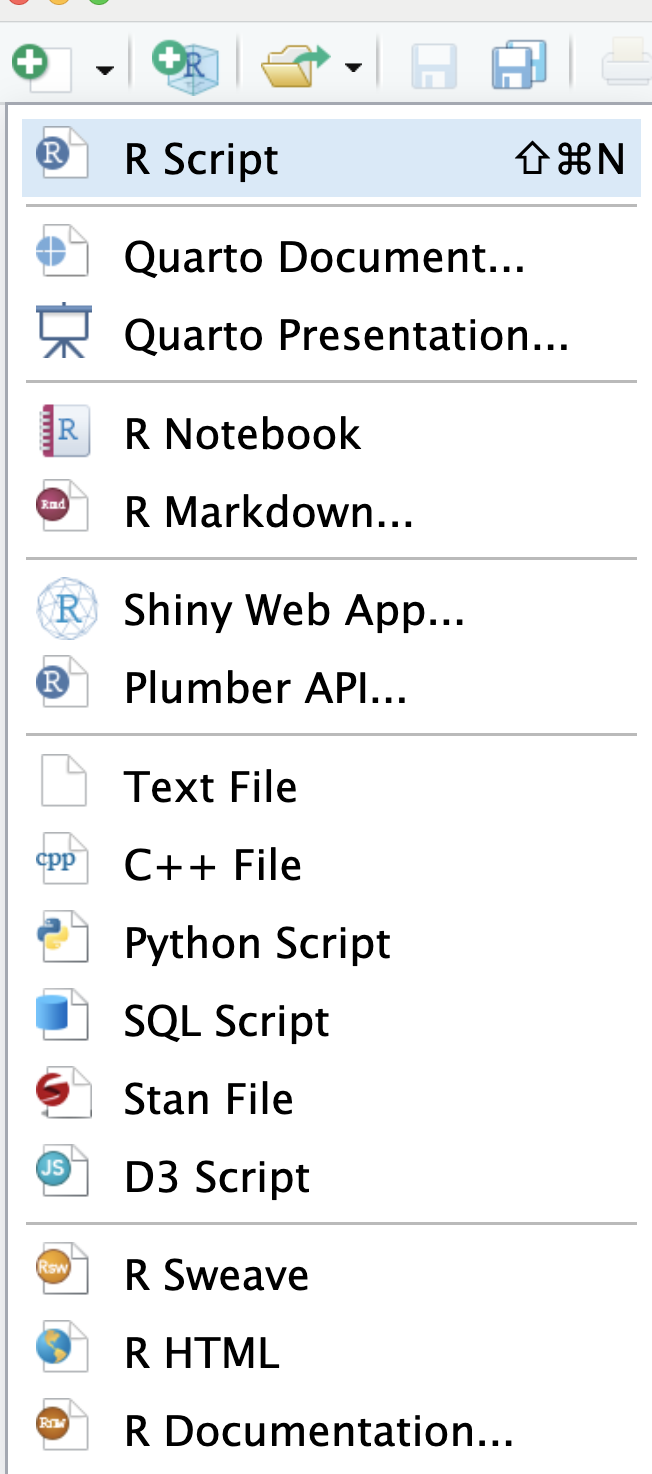
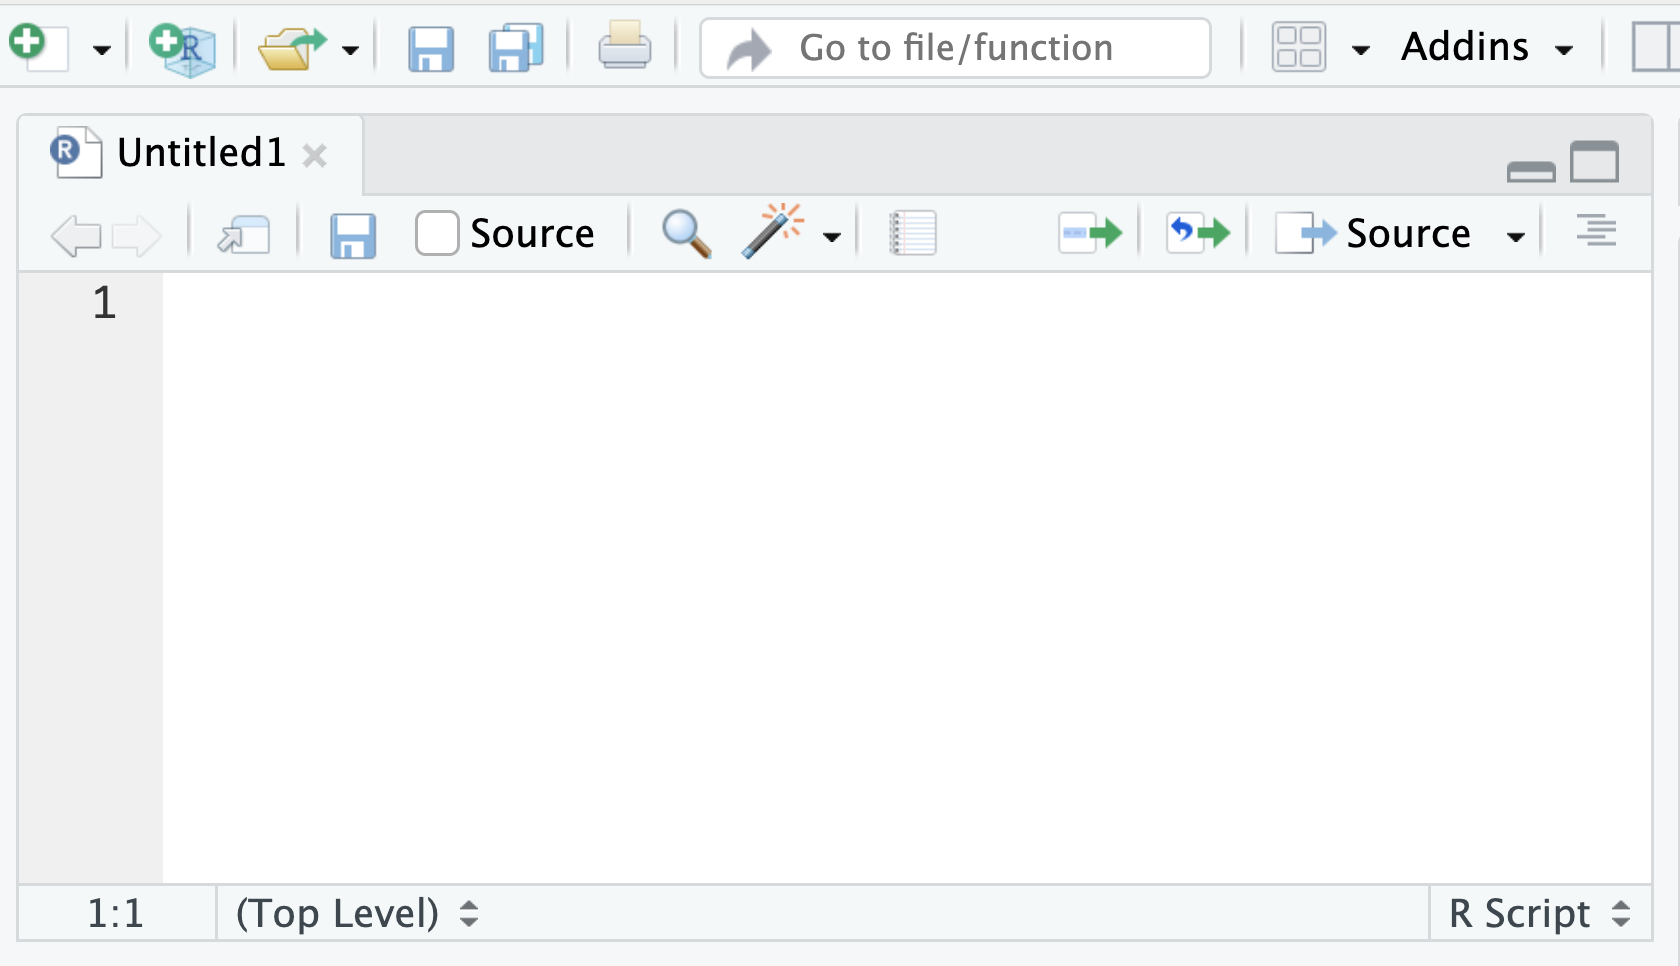
Create R Script
How to use this file
- Run one line at a time: place cursor on a line:
Ctrl + Enter(Win) /Cmd + Enter(Mac) - Run a whole section: select lines →
Ctrl + Enter - Run the full file:
Ctrl + Shift + Enter - Output appears in the Console
Variables & Data Types
A variable stores a value, like a box, so you can reuse it.
Use
<-to assign (R’s way of saying “equals”):Alt + -(Win) /option + -(Mac)Character (text - always in quotes), numeric (whole number or decimal) and logical (TRUE or FALSE)
Create Variables
Comment is any line in R that starts with # - R completely ignores it when running code
Print a Variable
Type variable name and run
Type of a Variable
Type variable name and run
See a quick Summary of Variable
Your Turn
Create a variable called my_name with your name.
Create a variable called my_city with your city.
Print both. What class are they?
Beautiful R Codes
Writing readable code because other people might need to use your code.
Writing readable code because you might need to use your code, a few weeks/months/years after you’ve written it.
Put spaces between and around variable names and operators (
= + - * /).Break up long lines of code.
Keeping a consistent style.
Vector
A vector is a sequence of values of the SAME type.
c()function means “combine” - it is how to build a vector.
Print Vector
Access Individual Elements
R starts counting from 1
Arithmetic on Vector
Built-in Summary Functions
length(scores)for how many elements?sum(scores)for totalmean(scores)for averagemedian(scores)for middle valuemax(scores)for highestmin(scores)for lowestrange(scores)for min and max togethersd(scores)for standard deviation
Cons of R Script (.R File)
Output is not saved with the code - plots appear in the Plots pane and results in the Console, but closing RStudio loses everything; you have to rerun the script every time to see the output again.
No narrative or context - you can only add short comments with
#; there is no space to explain your thinking, interpret results, or present findings in a readable way for others.Not reproducible as a report — a
.Rfile cannot be directly shared as a document; turning your analysis into something a non-coder can read requires extra steps, unlike.qmdwhich renders everything in one click.
Your Turn
Create a vector of 5 temperatures (any values you like).
Find the mean, max, and min.
Which temperatures are above 30? (use >= 30)
Data Frames
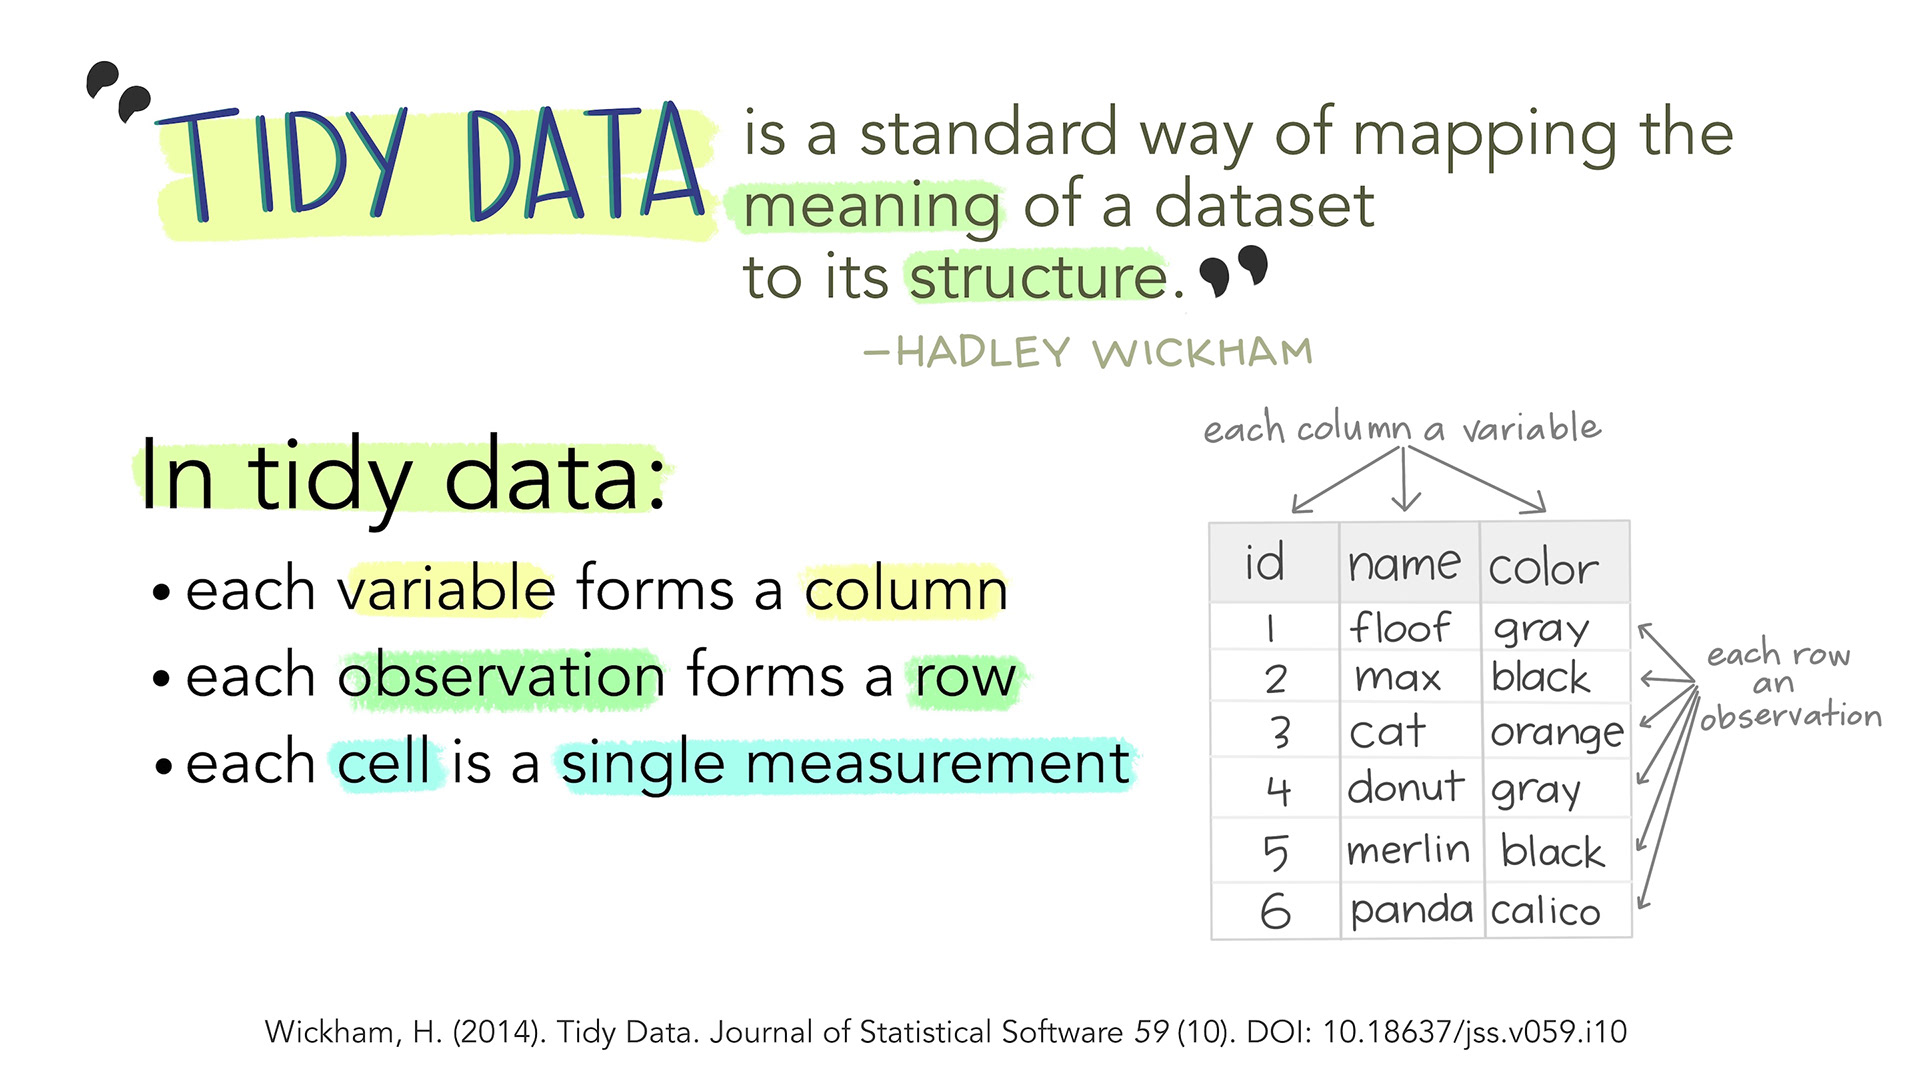
Data Frame
    name    city score passed
1  Priya   Delhi    88   TRUE
2  Rahul  Jaipur    75   TRUE
3  Anita  Mumbai    92   TRUE
4 Suresh Lucknow    60  FALSE
5  Meena    Pune    85   TRUE
Look at the data frame
head(participants)first 6 rows (useful for big data)tail(participants)last 6 rowsnrow(participants)number of rowsncol(participants)number of columnsdim(participants)rows and columns togethernames(participants)column namesstr(participants)structure — types of each columnsummary(participants)quick stats for each column
Access columns using $
— gives you the whole column as a vector
Access a specific [row, column]
Filter rows - who passed?
Who scored above 80?
Add a new column
Your Turn
- Create a data frame with 4 of your friends:
name,age, andfavourite_subject. - Print only the
nameandfavourite_subjectcolumns. - Filter: who is older than
25?
R Packages
R Packages 📦
“An R package is a collection of functions, data, and documentation that extends the capabilities of base R. Using packages is key to the successful use of R.”
Source: R for Data Science, 2e
R Packages
Install the R package
Call the R package
Update the R package
Remove the R package
Install Packages
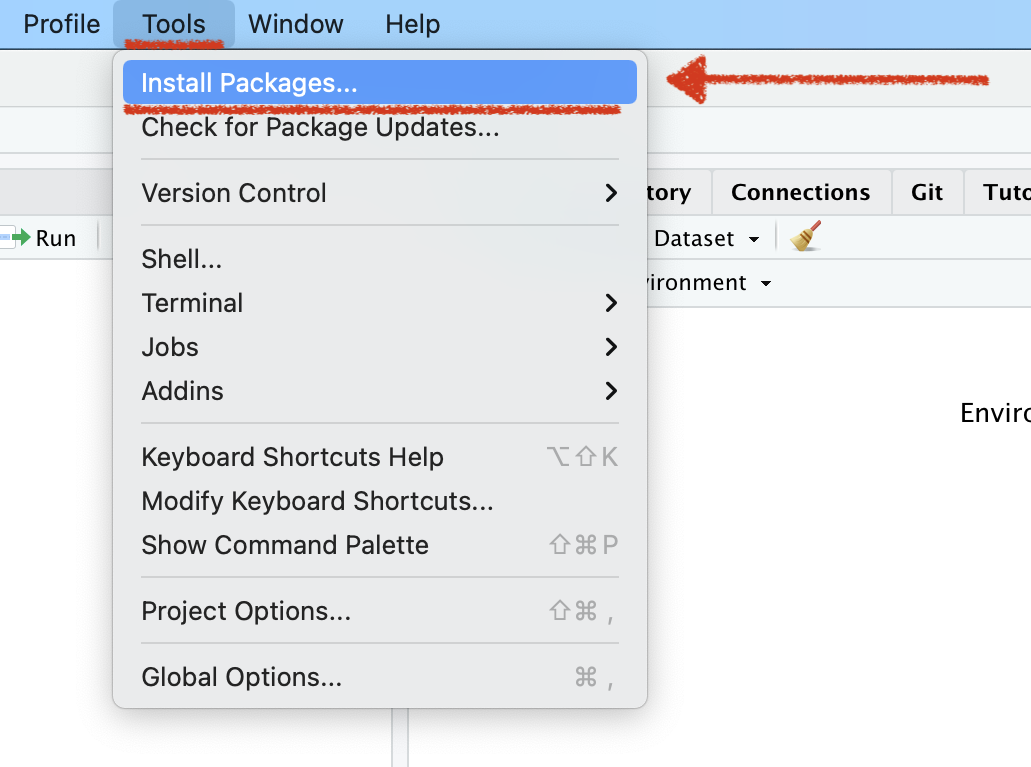
Name of the Packages
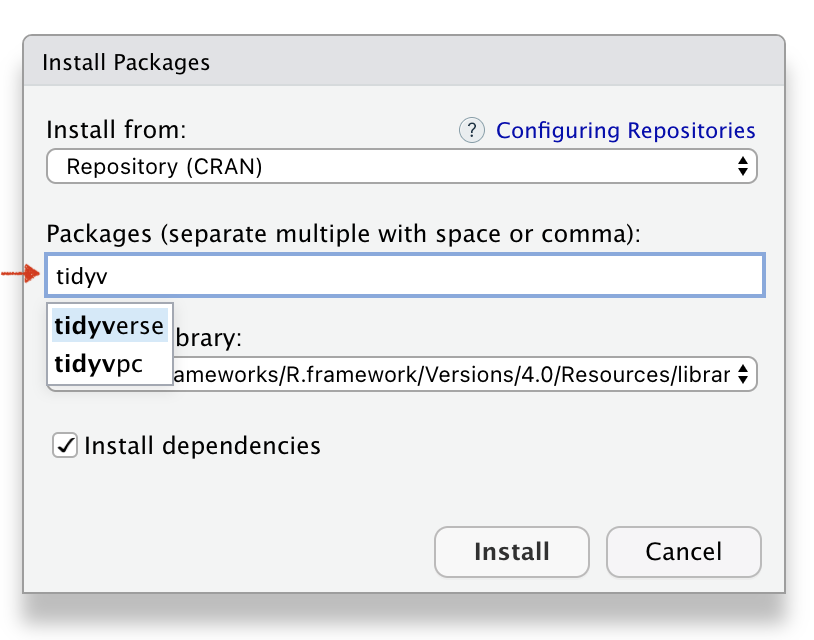
Installed Packages
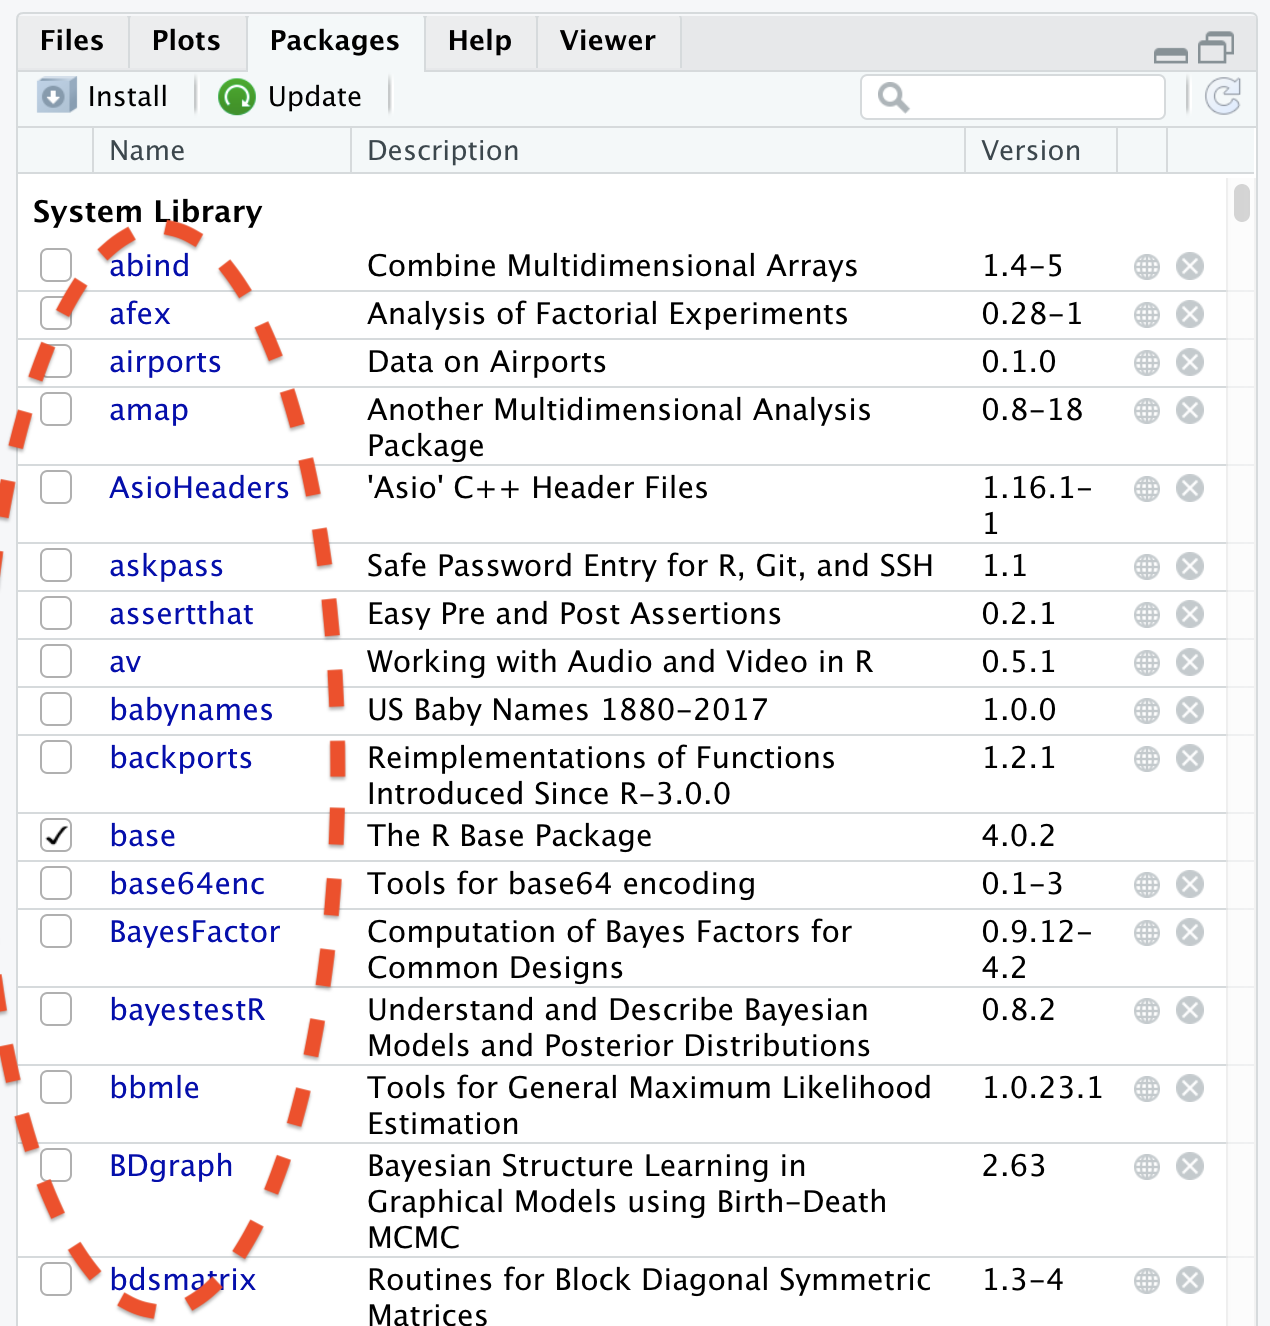
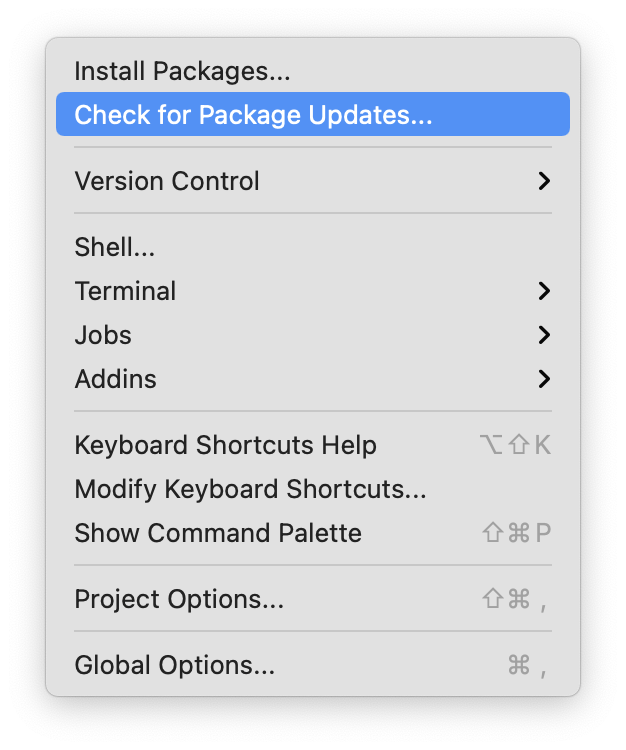
Tools \(\rightarrow\) Package Updates
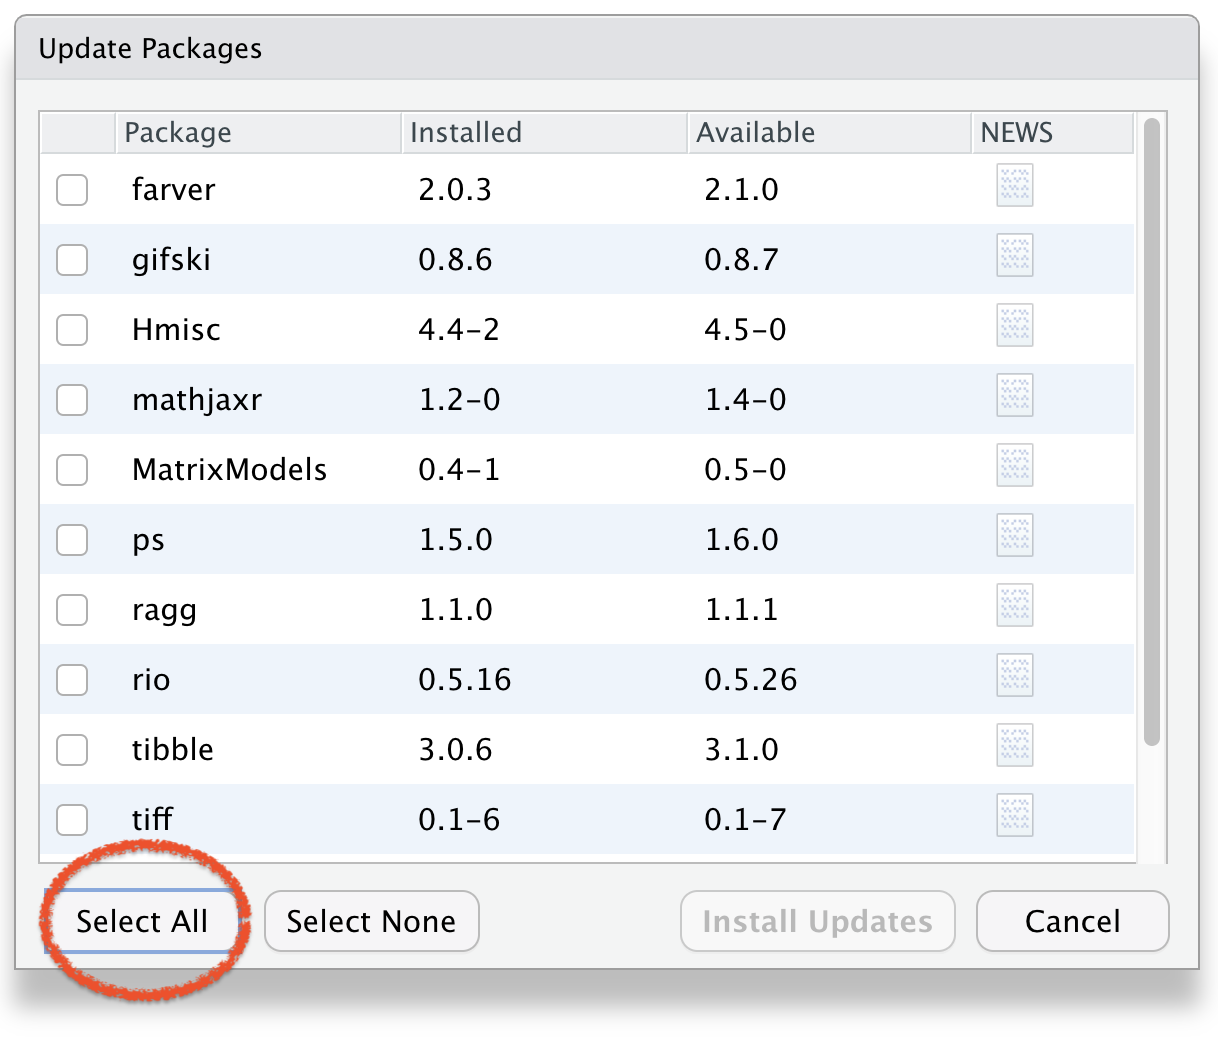
Select Packages to Update
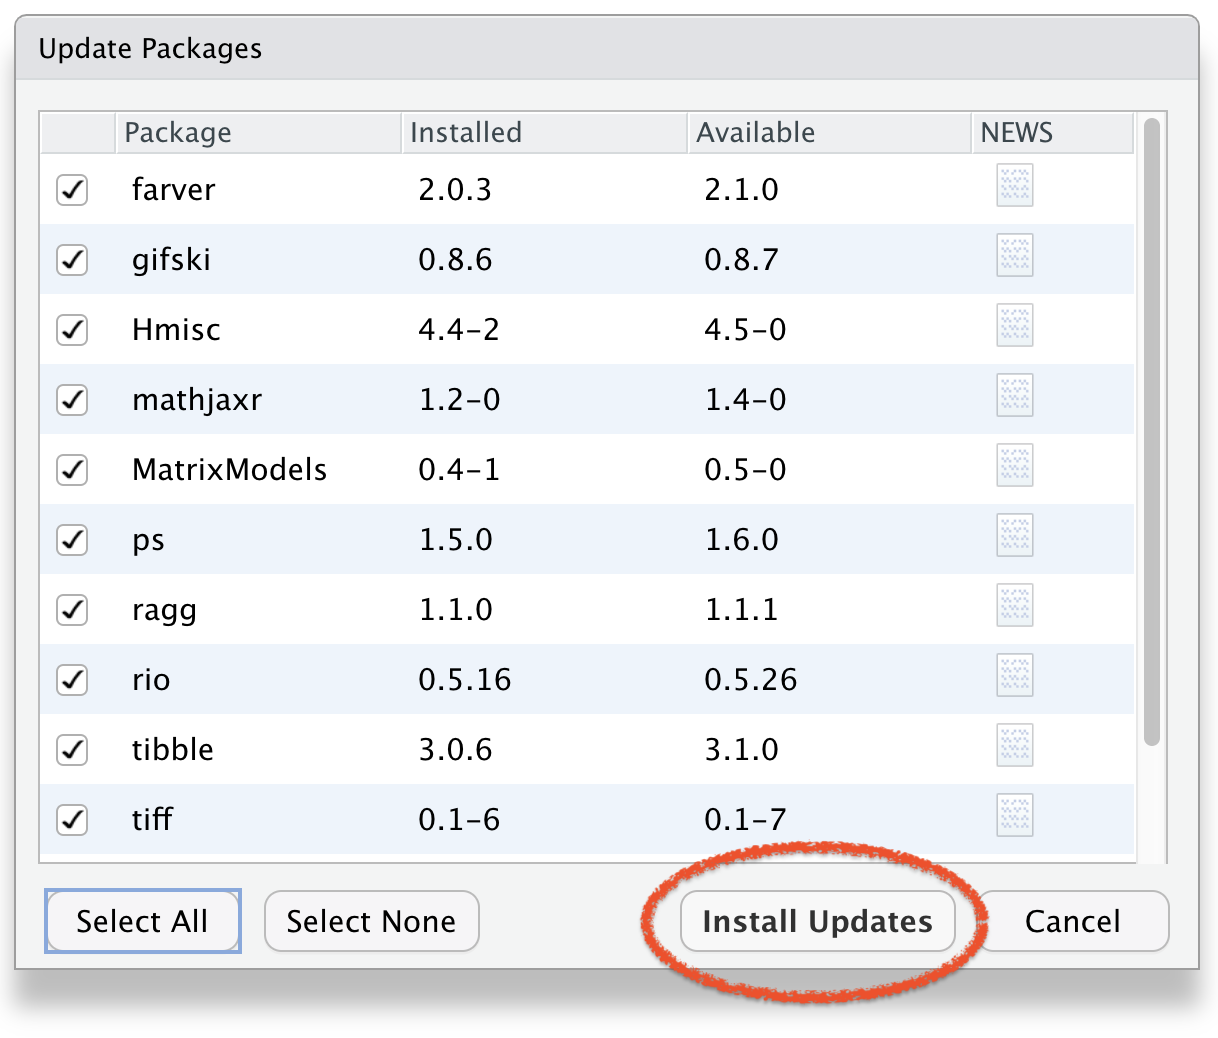
Click Install Updates
To Remove Packages
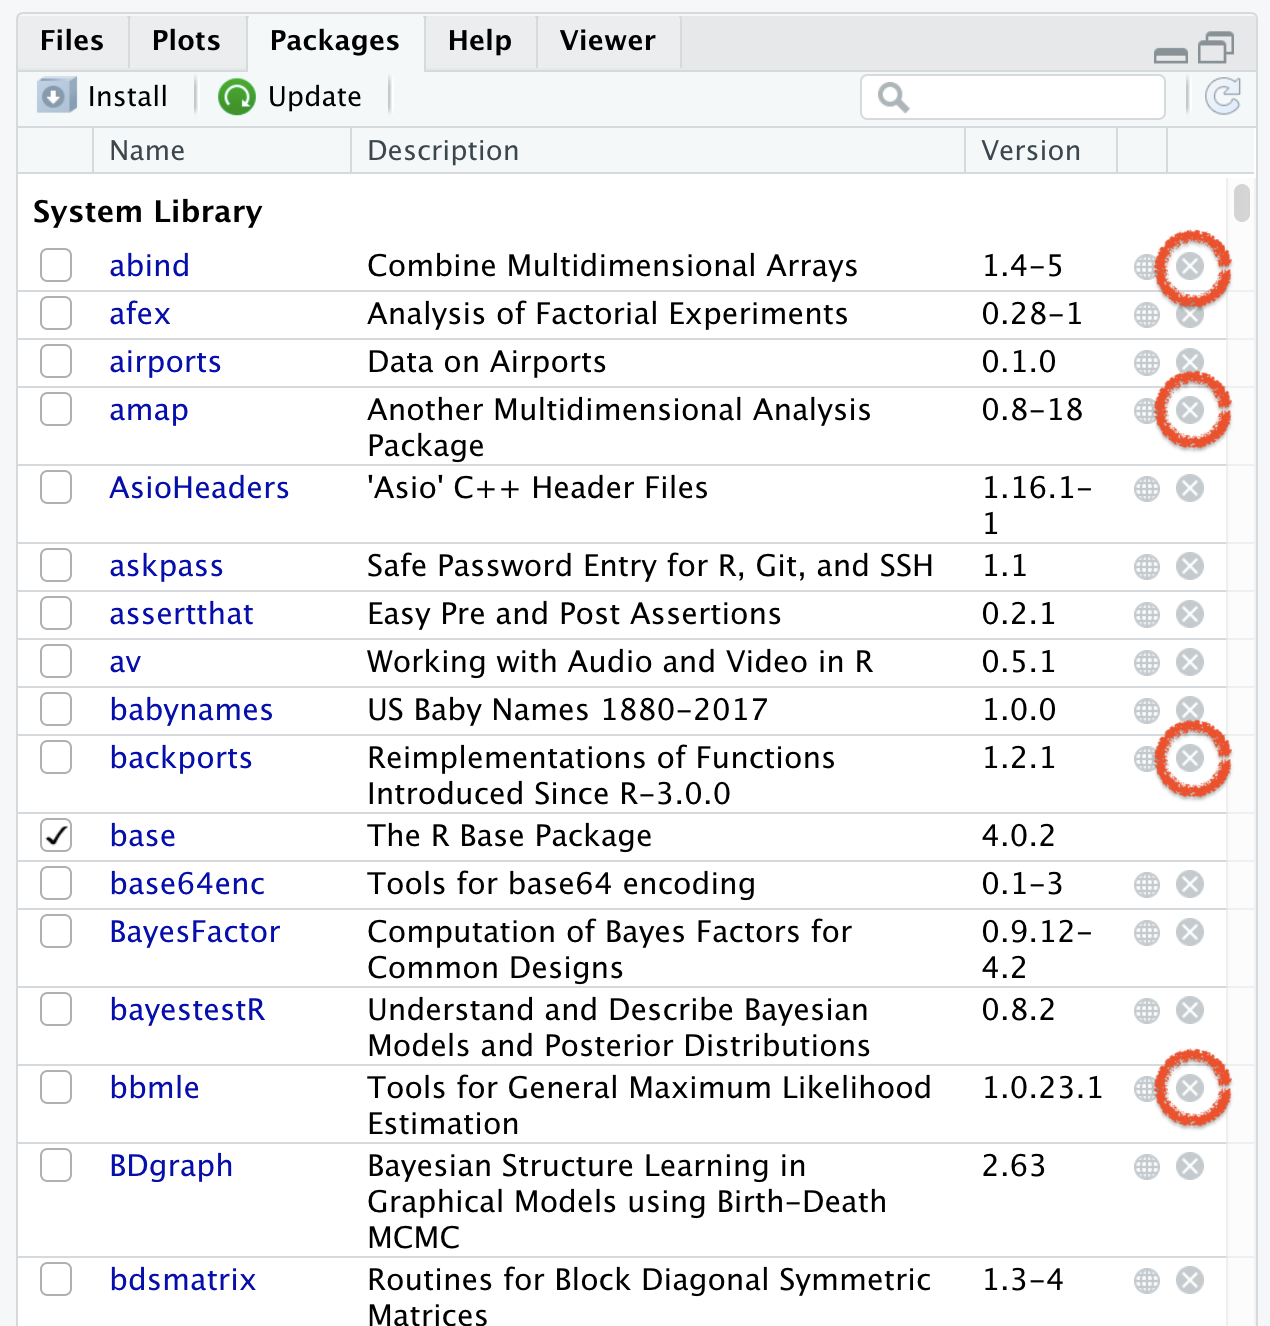
Functions for Packages
If you un-install R or RStudio, you will lose all installed packages.
Create your own R Functions
- A function is a reusable block of code that does one job.
- We have already used built-in functions:
mean(),sum(),c()
Basic structure of Function
Write a R Function
- function name - what we call it
add_numbers() - An argument - what you give it
function(x, y) - A body - what it does with it
{result <- x + y&return(result)}
Example 1 - Add two numbers
Example 2 - Greet a participant
Example 3 - Convert Marks to Percent
Example 4 — Classify a Score
Your Turn
- Write a function called celsius_to_fahrenheit that converts temperature:
F = (C * 9/5) + 32. - Test it with 0, 100, and 37 (body temperature)
Answers
Quarto
Quarto
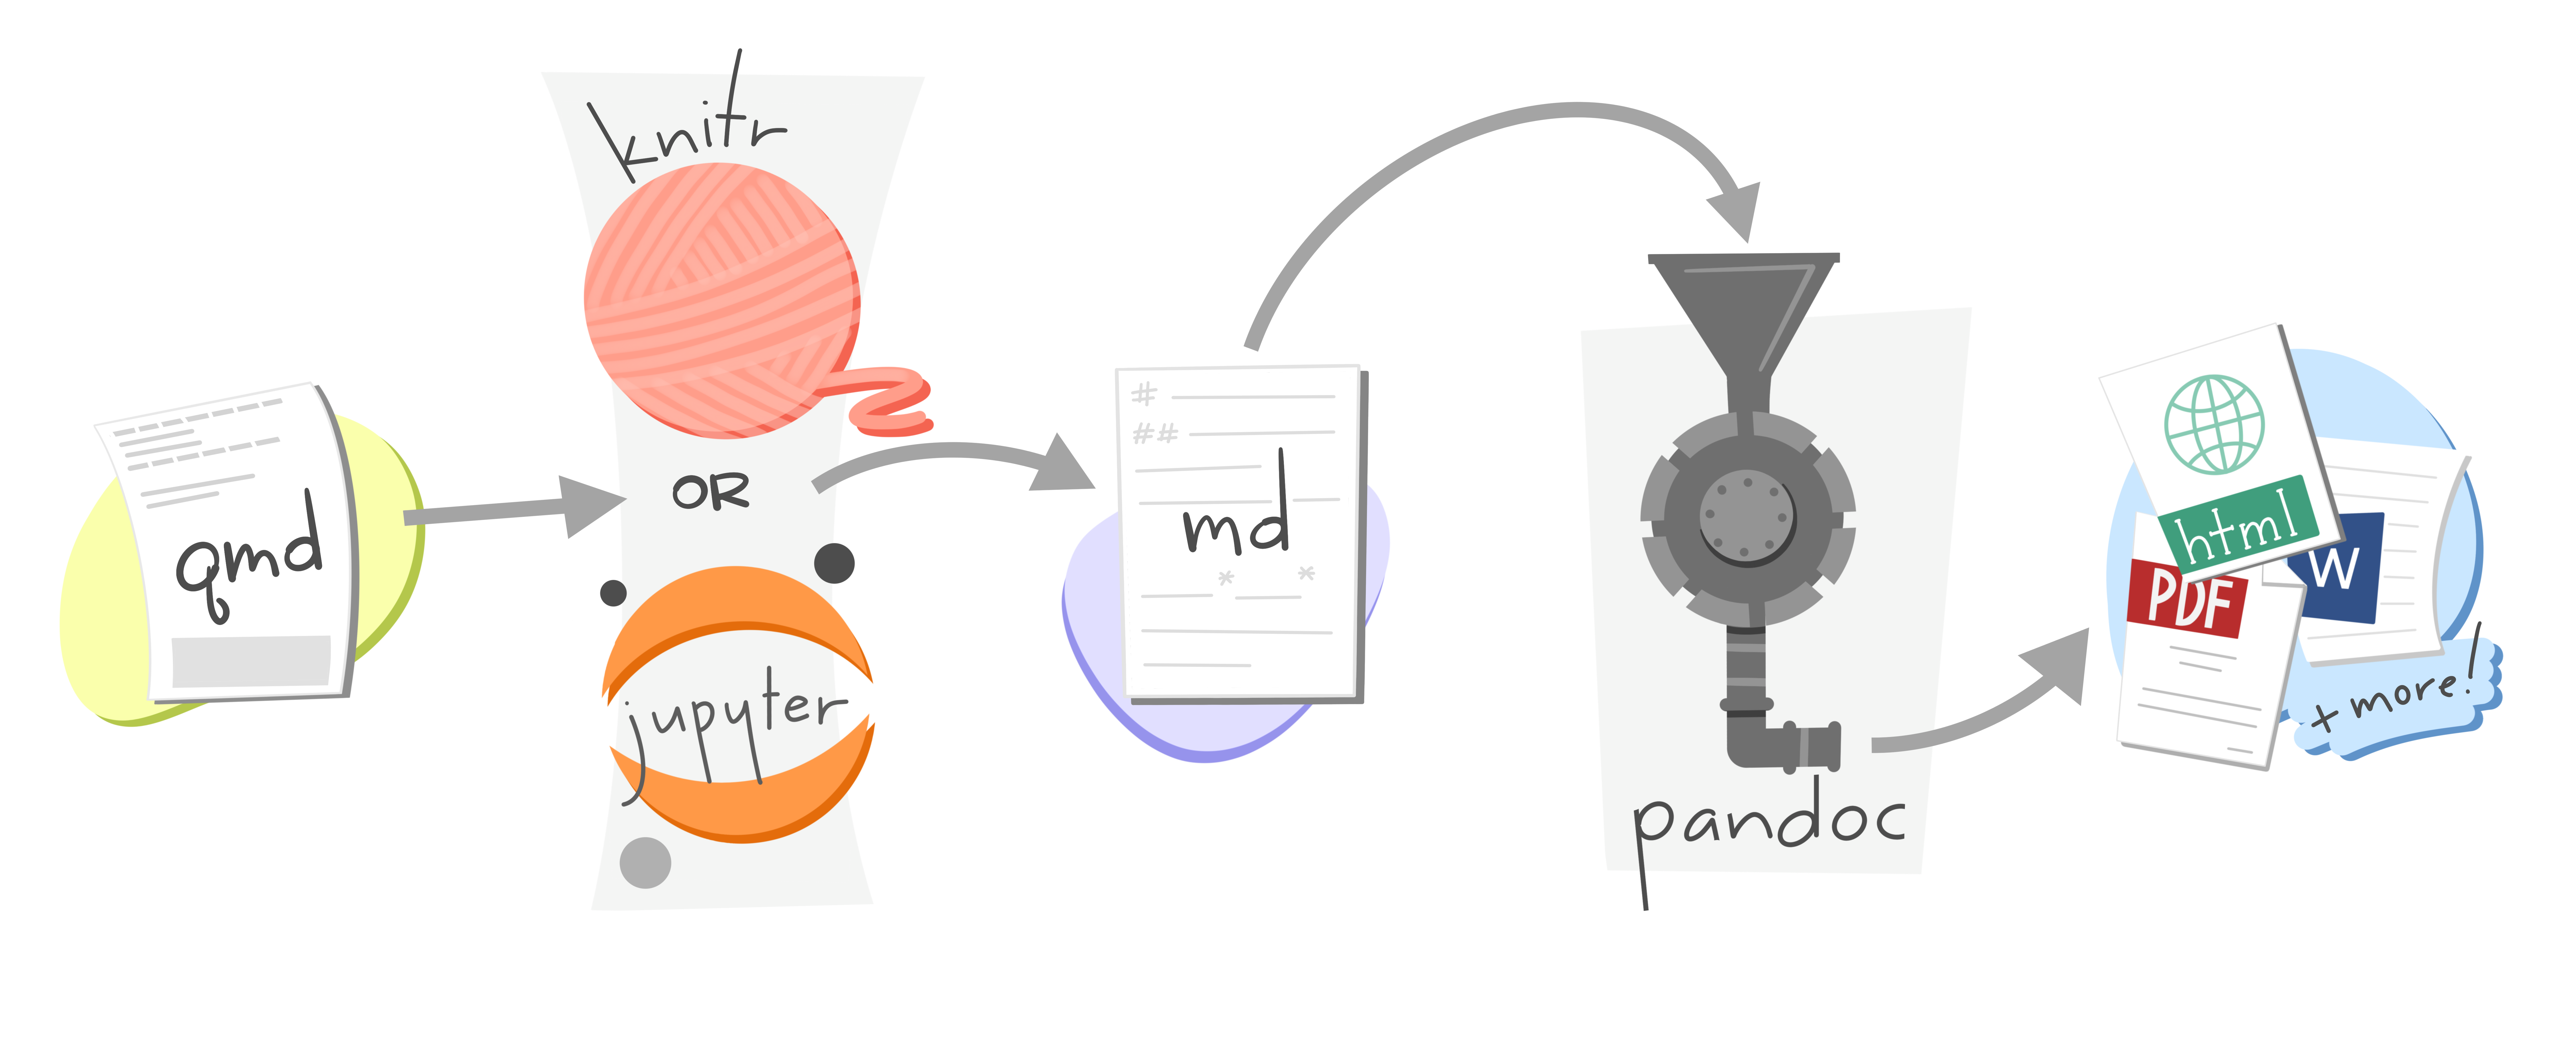
“An open-source scientific and technical publishing system”
Source: https://quarto.org/ | Artwork from Allison Horst
Quarto Workflow
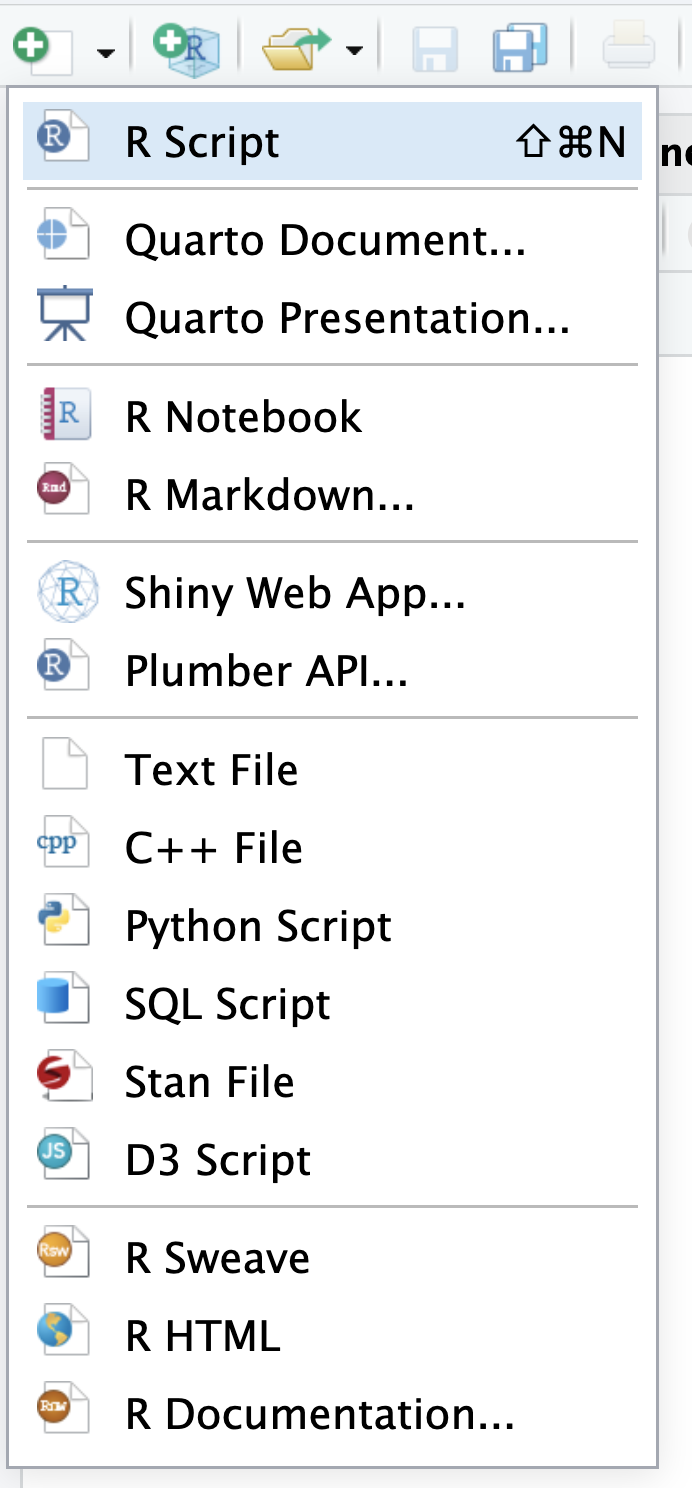
Create Quarto Document
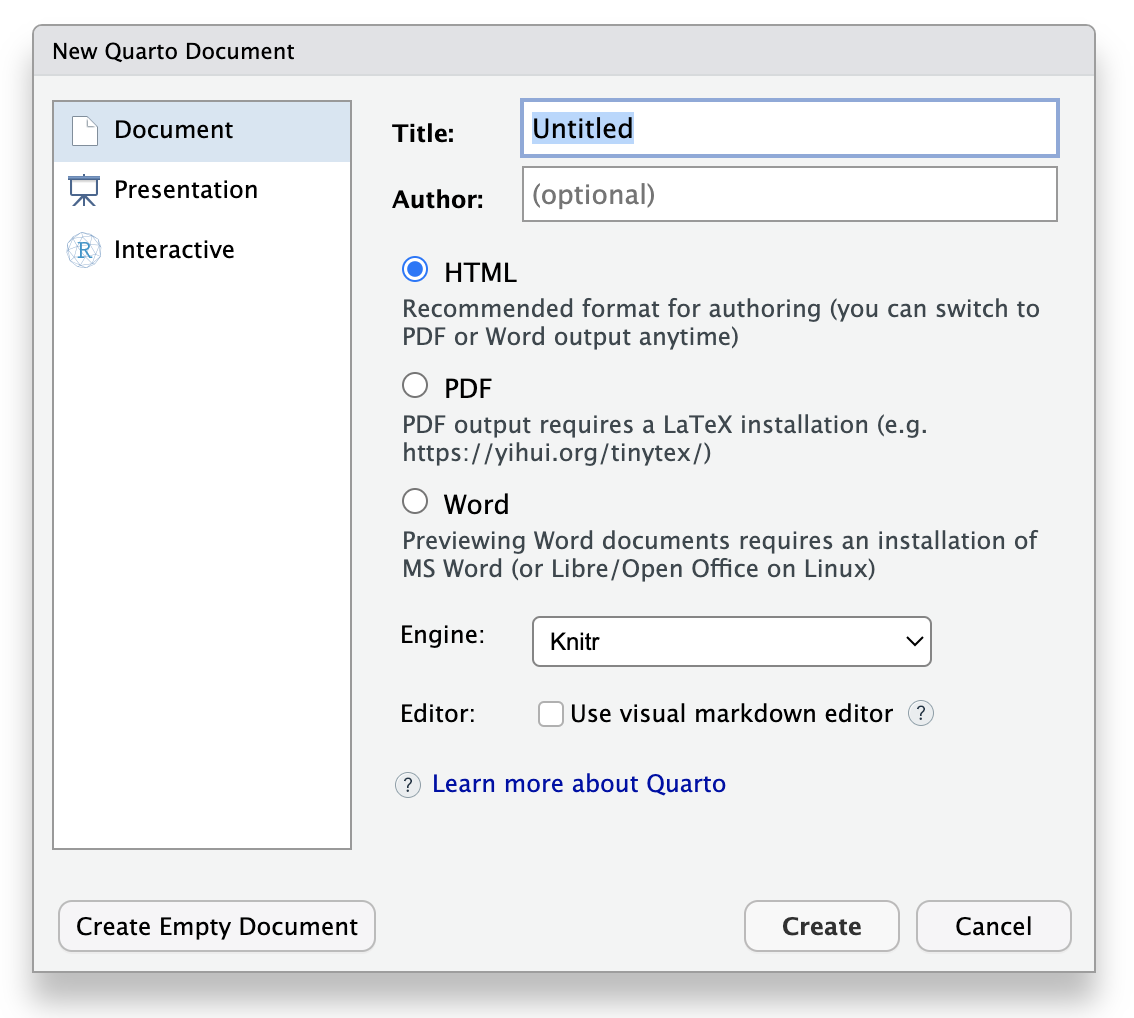
Quarto Main Components
YAML
Markdown Text
Code Chunk/Block/Cell
YAML
More YAML options for HTML ouput https://quarto.org/docs/reference/formats/html.html
Markdown Syntax
---
title: "Hello World"
subtitle: "2nd SARA Bootcamp 2026"
author: "Dr. Ajay Kumar Koli"
date: today
format: html
---
## First Time Coding
- Relax
- Patience
## Having Fun
This is *just* the beginning.
It will be **awesome** at the end.
Learn more from this link <https://quarto.org/docs/reference/formats/html.html>.
## Add Image
Markdown basics https://quarto.org/docs/authoring/markdown-basics.html
Code Blocks
---
title: "ggplot2 demo"
author: "Norah Jones"
date: "5/22/2021"
format:
  html:
    code-fold: true
---

## Air Quality

@fig-airquality further explores the impact of temperature on ozone level.

```{r}
#| label: fig-airquality
#| fig-cap: "Temperature and ozone level."
#| warning: false

library(ggplot2)

ggplot(airquality, aes(Temp, Ozone)) +
  geom_point() +
  geom_smooth(method = "loess")
```
R Code Blocks https://quarto.org/docs/computations/r.html
Inline Code
Quarto Output Formats
Caution
Not all YAML options are supported across every output format.
Thank you!
Module 1 complete 🎉
SARA Institute of Data Science - 3rd SARA Summer School 22-26 July 2026 “R for Researchers”
Course Slides website: https://sara-course-r4b.netlify.app/